
Advertisement
- India
- /
- Auto Components
- /
- NSEI:SUNDRMBRAK
Sundaram Brake Linings Limited (NSE:SUNDRMBRAK) Held Back By Insufficient Growth Even After Shares Climb 26%
Sundaram Brake Linings Limited (NSE:SUNDRMBRAK) shareholders are no doubt pleased to see that the share price has bounced 26% in the last month, although it is still struggling to make up recently lost ground. The last 30 days bring the annual gain to a very sharp 82%.
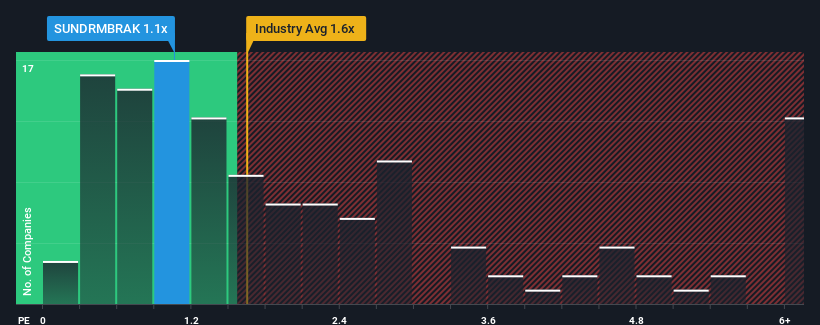
Even after such a large jump in price, considering around half the companies operating in India's Auto Components industry have price-to-sales ratios (or "P/S") above 1.6x, you may still consider Sundaram Brake Linings as an solid investment opportunity with its 1.1x P/S ratio. However, the P/S might be low for a reason and it requires further investigation to determine if it's justified.
Check out our latest analysis for Sundaram Brake Linings
How Sundaram Brake Linings Has Been Performing
For example, consider that Sundaram Brake Linings' financial performance has been poor lately as its revenue has been in decline. One possibility is that the P/S is low because investors think the company won't do enough to avoid underperforming the broader industry in the near future. If you like the company, you'd be hoping this isn't the case so that you could potentially pick up some stock while it's out of favour.
We don't have analyst forecasts, but you can see how recent trends are setting up the company for the future by checking out our free report on Sundaram Brake Linings' earnings, revenue and cash flow.How Is Sundaram Brake Linings' Revenue Growth Trending?
There's an inherent assumption that a company should underperform the industry for P/S ratios like Sundaram Brake Linings' to be considered reasonable.
Retrospectively, the last year delivered a frustrating 4.5% decrease to the company's top line. That put a dampener on the good run it was having over the longer-term as its three-year revenue growth is still a noteworthy 27% in total. Although it's been a bumpy ride, it's still fair to say the revenue growth recently has been mostly respectable for the company.
Comparing the recent medium-term revenue trends against the industry's one-year growth forecast of 10% shows it's noticeably less attractive.
With this in consideration, it's easy to understand why Sundaram Brake Linings' P/S falls short of the mark set by its industry peers. It seems most investors are expecting to see the recent limited growth rates continue into the future and are only willing to pay a reduced amount for the stock.
What We Can Learn From Sundaram Brake Linings' P/S?
Despite Sundaram Brake Linings' share price climbing recently, its P/S still lags most other companies. Typically, we'd caution against reading too much into price-to-sales ratios when settling on investment decisions, though it can reveal plenty about what other market participants think about the company.
In line with expectations, Sundaram Brake Linings maintains its low P/S on the weakness of its recent three-year growth being lower than the wider industry forecast. At this stage investors feel the potential for an improvement in revenue isn't great enough to justify a higher P/S ratio. Unless the recent medium-term conditions improve, they will continue to form a barrier for the share price around these levels.
You always need to take note of risks, for example - Sundaram Brake Linings has 2 warning signs we think you should be aware of.
If you're unsure about the strength of Sundaram Brake Linings' business, why not explore our interactive list of stocks with solid business fundamentals for some other companies you may have missed.
New: Manage All Your Stock Portfolios in One Place
We've created the ultimate portfolio companion for stock investors, and it's free.
• Connect an unlimited number of Portfolios and see your total in one currency
• Be alerted to new Warning Signs or Risks via email or mobile
• Track the Fair Value of your stocks
Have feedback on this article? Concerned about the content? Get in touch with us directly. Alternatively, email editorial-team (at) simplywallst.com.
This article by Simply Wall St is general in nature. We provide commentary based on historical data and analyst forecasts only using an unbiased methodology and our articles are not intended to be financial advice. It does not constitute a recommendation to buy or sell any stock, and does not take account of your objectives, or your financial situation. We aim to bring you long-term focused analysis driven by fundamental data. Note that our analysis may not factor in the latest price-sensitive company announcements or qualitative material. Simply Wall St has no position in any stocks mentioned.
About NSEI:SUNDRMBRAK
Sundaram Brake Linings
Manufactures and sells asbestos free friction materials in India and internationally.
Mediocre balance sheet and slightly overvalued.
Similar Companies
Market Insights

Advertisement
Community Narratives
MicroVision will explode future revenue by 380.37% with a vision towards success
Fair Value US$60.00|98.3% undervalued
TH
Community Contributor
The Indispensable Artery for a New North American Economy
Fair Value CA$132.87|1.0% undervalued
TI
Community Contributor