
Advertisement
- India
- /
- Auto Components
- /
- NSEI:SHARDAMOTR
Sharda Motor Industries (NSE:SHARDAMOTR) Has Gifted Shareholders With A Fantastic 196% Total Return On Their Investment
When you buy shares in a company, it's worth keeping in mind the possibility that it could fail, and you could lose your money. But on the bright side, you can make far more than 100% on a really good stock. One great example is Sharda Motor Industries Limited (NSE:SHARDAMOTR) which saw its share price drive 136% higher over five years. Better yet, the share price has gained 143% in the last quarter.
See our latest analysis for Sharda Motor Industries
To quote Buffett, 'Ships will sail around the world but the Flat Earth Society will flourish. There will continue to be wide discrepancies between price and value in the marketplace...' By comparing earnings per share (EPS) and share price changes over time, we can get a feel for how investor attitudes to a company have morphed over time.
Sharda Motor Industries' earnings per share are down 4.6% per year, despite strong share price performance over five years.
So it's hard to argue that the earnings per share are the best metric to judge the company, as it may not be optimized for profits at this point. Since the change in EPS doesn't seem to correlate with the change in share price, it's worth taking a look at other metrics.
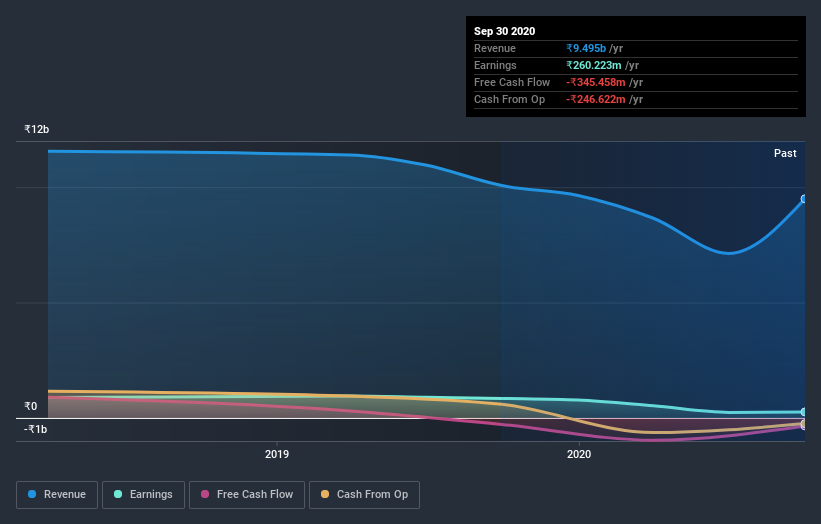
It is not great to see that revenue has dropped by 0.5% per year over five years. So it seems one might have to take closer look at earnings and revenue trends to see how they might influence the share price.
The graphic below depicts how earnings and revenue have changed over time (unveil the exact values by clicking on the image).
Balance sheet strength is crucial. It might be well worthwhile taking a look at our free report on how its financial position has changed over time.
What about the Total Shareholder Return (TSR)?
We'd be remiss not to mention the difference between Sharda Motor Industries' total shareholder return (TSR) and its share price return. The TSR attempts to capture the value of dividends (as if they were reinvested) as well as any spin-offs or discounted capital raisings offered to shareholders. Dividends have been really beneficial for Sharda Motor Industries shareholders, and that cash payout contributed to why its TSR of 196%, over the last 5 years, is better than the share price return.
A Different Perspective
We're pleased to report that Sharda Motor Industries shareholders have received a total shareholder return of 140% over one year. That's better than the annualised return of 24% over half a decade, implying that the company is doing better recently. Given the share price momentum remains strong, it might be worth taking a closer look at the stock, lest you miss an opportunity. I find it very interesting to look at share price over the long term as a proxy for business performance. But to truly gain insight, we need to consider other information, too. For example, we've discovered 3 warning signs for Sharda Motor Industries (1 is concerning!) that you should be aware of before investing here.
If you like to buy stocks alongside management, then you might just love this free list of companies. (Hint: insiders have been buying them).
Please note, the market returns quoted in this article reflect the market weighted average returns of stocks that currently trade on IN exchanges.
If you decide to trade Sharda Motor Industries, use the lowest-cost* platform that is rated #1 Overall by Barron’s, Interactive Brokers. Trade stocks, options, futures, forex, bonds and funds on 135 markets, all from a single integrated account. Promoted
New: Manage All Your Stock Portfolios in One Place
We've created the ultimate portfolio companion for stock investors, and it's free.
• Connect an unlimited number of Portfolios and see your total in one currency
• Be alerted to new Warning Signs or Risks via email or mobile
• Track the Fair Value of your stocks
This article by Simply Wall St is general in nature. It does not constitute a recommendation to buy or sell any stock, and does not take account of your objectives, or your financial situation. We aim to bring you long-term focused analysis driven by fundamental data. Note that our analysis may not factor in the latest price-sensitive company announcements or qualitative material. Simply Wall St has no position in any stocks mentioned.
*Interactive Brokers Rated Lowest Cost Broker by StockBrokers.com Annual Online Review 2020
Have feedback on this article? Concerned about the content? Get in touch with us directly. Alternatively, email editorial-team (at) simplywallst.com.
About NSEI:SHARDAMOTR
Sharda Motor Industries
Manufactures, assembles, trades in, and sells auto components to automobiles and electronics original equipment manufacturers in India.
Excellent balance sheet established dividend payer.
Market Insights

Advertisement
Community Narratives
The company that turned a verb into a global necessity and basically runs the modern internet, digital ads, smartphones, maps, and AI.
Fair Value US$300.00|5.4% undervalued
OS
Community Contributor
Flowers Foods Pays A Fair Price For Health
Fair Value US$16.12|26.3% undervalued
NV
Community Contributor
TMX Group will thrive with 33.3% profit margin and enduring market moat
Fair Value CA$49.90|4.1% overvalued
LI
Community Contributor
The "Molecular Pencil": Why Beam's Technology is Built to Win
Fair Value US$65.01|62.7% undervalued
DA
Community Contributor