Stock Analysis
Is STG International Ltd.'s (TLV:STG) Recent Stock Performance Tethered To Its Strong Fundamentals?


STG International (TLV:STG) has had a great run on the share market with its stock up by a significant 16% over the last month. Given the company's impressive performance, we decided to study its financial indicators more closely as a company's financial health over the long-term usually dictates market outcomes. Particularly, we will be paying attention to STG International's ROE today.
Return on equity or ROE is a key measure used to assess how efficiently a company's management is utilizing the company's capital. In other words, it is a profitability ratio which measures the rate of return on the capital provided by the company's shareholders.
See our latest analysis for STG International
How To Calculate Return On Equity?
ROE can be calculated by using the formula:
Return on Equity = Net Profit (from continuing operations) ÷ Shareholders' Equity
So, based on the above formula, the ROE for STG International is:
18% = ₪20m ÷ ₪107m (Based on the trailing twelve months to June 2023).
The 'return' is the profit over the last twelve months. Another way to think of that is that for every ₪1 worth of equity, the company was able to earn ₪0.18 in profit.
Why Is ROE Important For Earnings Growth?
Thus far, we have learned that ROE measures how efficiently a company is generating its profits. We now need to evaluate how much profit the company reinvests or "retains" for future growth which then gives us an idea about the growth potential of the company. Generally speaking, other things being equal, firms with a high return on equity and profit retention, have a higher growth rate than firms that don’t share these attributes.
STG International's Earnings Growth And 18% ROE
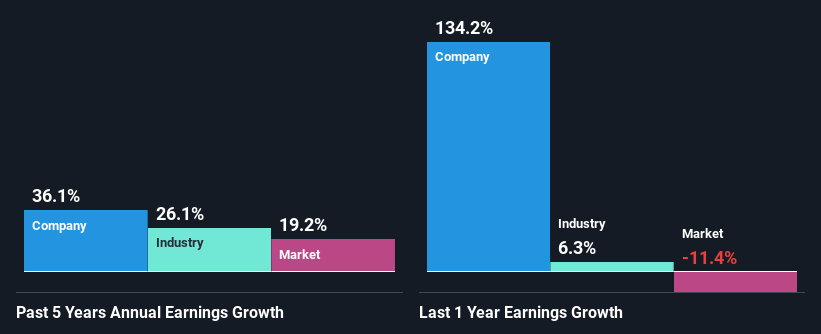
At first glance, STG International seems to have a decent ROE. Further, the company's ROE is similar to the industry average of 16%. This certainly adds some context to STG International's exceptional 36% net income growth seen over the past five years. However, there could also be other drivers behind this growth. For instance, the company has a low payout ratio or is being managed efficiently.
As a next step, we compared STG International's net income growth with the industry, and pleasingly, we found that the growth seen by the company is higher than the average industry growth of 26%.
Earnings growth is an important metric to consider when valuing a stock. It’s important for an investor to know whether the market has priced in the company's expected earnings growth (or decline). Doing so will help them establish if the stock's future looks promising or ominous. Is STG International fairly valued compared to other companies? These 3 valuation measures might help you decide.
Is STG International Using Its Retained Earnings Effectively?
Given that STG International doesn't pay any dividend to its shareholders, we infer that the company has been reinvesting all of its profits to grow its business.
Summary
In total, we are pretty happy with STG International's performance. In particular, it's great to see that the company is investing heavily into its business and along with a high rate of return, that has resulted in a sizeable growth in its earnings. If the company continues to grow its earnings the way it has, that could have a positive impact on its share price given how earnings per share influence long-term share prices. Let's not forget, business risk is also one of the factors that affects the price of the stock. So this is also an important area that investors need to pay attention to before making a decision on any business. Our risks dashboard will have the 1 risk we have identified for STG International.
New: Manage All Your Stock Portfolios in One Place
We've created the ultimate portfolio companion for stock investors, and it's free.
• Connect an unlimited number of Portfolios and see your total in one currency
• Be alerted to new Warning Signs or Risks via email or mobile
• Track the Fair Value of your stocks
Have feedback on this article? Concerned about the content? Get in touch with us directly. Alternatively, email editorial-team (at) simplywallst.com.
This article by Simply Wall St is general in nature. We provide commentary based on historical data and analyst forecasts only using an unbiased methodology and our articles are not intended to be financial advice. It does not constitute a recommendation to buy or sell any stock, and does not take account of your objectives, or your financial situation. We aim to bring you long-term focused analysis driven by fundamental data. Note that our analysis may not factor in the latest price-sensitive company announcements or qualitative material. Simply Wall St has no position in any stocks mentioned.
About TASE:STG
STG International
Operates as a reseller of electronic components, equipment, and systems in Israel.
Excellent balance sheet and good value.
