We Think Shareholders Are Less Likely To Approve A Pay Rise For Safe-T Group Ltd's (TLV:SFET) CEO For Now
In the past three years, the share price of Safe-T Group Ltd (TLV:SFET) has struggled to grow and now shareholders are sitting on a loss. Despite positive EPS growth in the past few years, the share price hasn't tracked the fundamental performance of the company. These are some of the concerns that shareholders may want to bring up at the next AGM held on 19 December 2022. They could also influence management through voting on resolutions such as executive remuneration. Here's our take on why we think shareholders may want to be cautious of approving a raise for the CEO at the moment.
Check out our latest analysis for Safe-T Group
Comparing Safe-T Group Ltd's CEO Compensation With The Industry
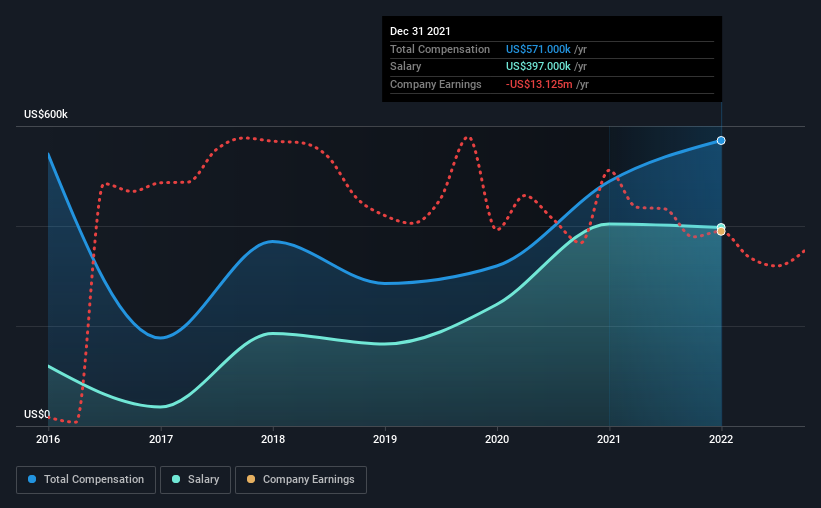
According to our data, Safe-T Group Ltd has a market capitalization of ₪31m, and paid its CEO total annual compensation worth US$571k over the year to December 2021. We note that's an increase of 17% above last year. We note that the salary portion, which stands at US$397.0k constitutes the majority of total compensation received by the CEO.
On comparing similar-sized companies in the industry with market capitalizations below ₪686m, we found that the median total CEO compensation was US$571k. So it looks like Safe-T Group compensates Shachar Daniel in line with the median for the industry.
| Component | 2021 | 2020 | Proportion (2021) |
| Salary | US$397k | US$404k | 70% |
| Other | US$174k | US$85k | 30% |
| Total Compensation | US$571k | US$489k | 100% |
Speaking on an industry level, nearly 61% of total compensation represents salary, while the remainder of 39% is other remuneration. Safe-T Group is paying a higher share of its remuneration through a salary in comparison to the overall industry. If salary dominates total compensation, it suggests that CEO compensation is leaning less towards the variable component, which is usually linked with performance.

Safe-T Group Ltd's Growth
Safe-T Group Ltd's earnings per share (EPS) grew 124% per year over the last three years. It achieved revenue growth of 123% over the last year.
This demonstrates that the company has been improving recently and is good news for the shareholders. It's great to see that revenue growth is strong, too. These metrics suggest the business is growing strongly. Moving away from current form for a second, it could be important to check this free visual depiction of what analysts expect for the future.
Has Safe-T Group Ltd Been A Good Investment?
The return of -93% over three years would not have pleased Safe-T Group Ltd shareholders. Therefore, it might be upsetting for shareholders if the CEO were paid generously.
To Conclude...
Despite the growth in its earnings, the share price decline in the past three years is certainly concerning. The stock's movement is disjointed with the company's earnings growth, which ideally should move in the same direction. If there are some unknown variables that are influencing the stock's price, surely shareholders would have some concerns. These concerns should be addressed at the upcoming AGM, where shareholders can question the board and evaluate if their judgement and decision making is still in line with their expectations.
We can learn a lot about a company by studying its CEO compensation trends, along with looking at other aspects of the business. We identified 5 warning signs for Safe-T Group (3 can't be ignored!) that you should be aware of before investing here.
Switching gears from Safe-T Group, if you're hunting for a pristine balance sheet and premium returns, this free list of high return, low debt companies is a great place to look.
New: Manage All Your Stock Portfolios in One Place
We've created the ultimate portfolio companion for stock investors, and it's free.
• Connect an unlimited number of Portfolios and see your total in one currency
• Be alerted to new Warning Signs or Risks via email or mobile
• Track the Fair Value of your stocks
Have feedback on this article? Concerned about the content? Get in touch with us directly. Alternatively, email editorial-team (at) simplywallst.com.
This article by Simply Wall St is general in nature. We provide commentary based on historical data and analyst forecasts only using an unbiased methodology and our articles are not intended to be financial advice. It does not constitute a recommendation to buy or sell any stock, and does not take account of your objectives, or your financial situation. We aim to bring you long-term focused analysis driven by fundamental data. Note that our analysis may not factor in the latest price-sensitive company announcements or qualitative material. Simply Wall St has no position in any stocks mentioned.
About TASE:ALAR
Alarum Technologies
Provides web data collection solutions in North, South, and Central America, Europe, Southeast Asia, the Middle East, and Africa.
High growth potential with excellent balance sheet.
Market Insights
Community Narratives


