Stock Analysis
Matrix IT Full Year 2023 Earnings: EPS: ₪3.58 (vs ₪5.32 in FY 2022)


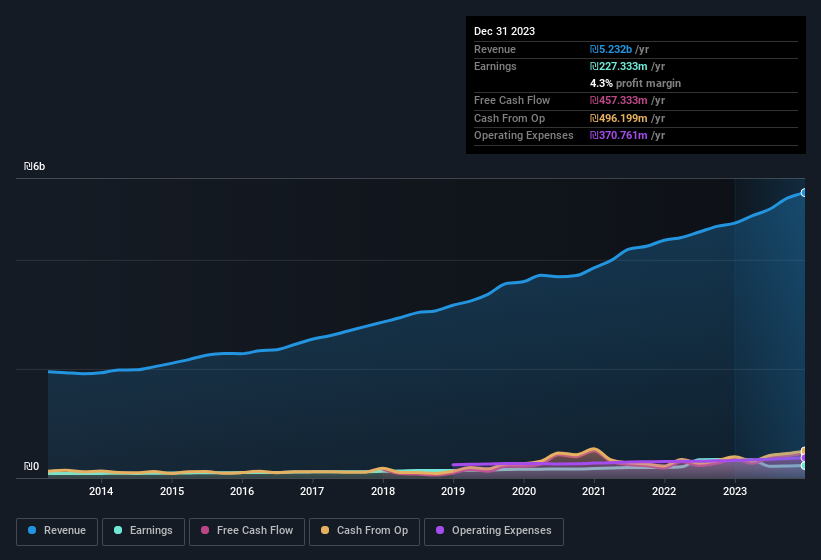
Matrix IT (TLV:MTRX) Full Year 2023 Results
Key Financial Results
- Revenue: ₪5.23b (up 12% from FY 2022).
- Net income: ₪227.3m (down 32% from FY 2022).
- Profit margin: 4.3% (down from 7.2% in FY 2022). The decrease in margin was driven by higher expenses.
- EPS: ₪3.58 (down from ₪5.32 in FY 2022).
All figures shown in the chart above are for the trailing 12 month (TTM) period
Matrix IT shares are up 3.4% from a week ago.
Risk Analysis
Be aware that Matrix IT is showing 1 warning sign in our investment analysis that you should know about...
New: Manage All Your Stock Portfolios in One Place
We've created the ultimate portfolio companion for stock investors, and it's free.
• Connect an unlimited number of Portfolios and see your total in one currency
• Be alerted to new Warning Signs or Risks via email or mobile
• Track the Fair Value of your stocks
Have feedback on this article? Concerned about the content? Get in touch with us directly. Alternatively, email editorial-team (at) simplywallst.com.
This article by Simply Wall St is general in nature. We provide commentary based on historical data and analyst forecasts only using an unbiased methodology and our articles are not intended to be financial advice. It does not constitute a recommendation to buy or sell any stock, and does not take account of your objectives, or your financial situation. We aim to bring you long-term focused analysis driven by fundamental data. Note that our analysis may not factor in the latest price-sensitive company announcements or qualitative material. Simply Wall St has no position in any stocks mentioned.
About TASE:MTRX
Matrix IT
Through with its subsidiaries, provides information technology solutions and services in Israel, the United States, Europe, internationally.
Flawless balance sheet established dividend payer.
