Stock Analysis
- Israel
- /
- Real Estate
- /
- TASE:PRSK
Optimism for Prashkovsky Investments and Construction (TLV:PRSK) has grown this past week, despite five-year decline in earnings


Generally speaking the aim of active stock picking is to find companies that provide returns that are superior to the market average. And while active stock picking involves risks (and requires diversification) it can also provide excess returns. For example, the Prashkovsky Investments and Construction Ltd. (TLV:PRSK) share price is up 94% in the last 5 years, clearly besting the market return of around 21% (ignoring dividends).
Since it's been a strong week for Prashkovsky Investments and Construction shareholders, let's have a look at trend of the longer term fundamentals.
See our latest analysis for Prashkovsky Investments and Construction
In his essay The Superinvestors of Graham-and-Doddsville Warren Buffett described how share prices do not always rationally reflect the value of a business. One imperfect but simple way to consider how the market perception of a company has shifted is to compare the change in the earnings per share (EPS) with the share price movement.
During five years of share price growth, Prashkovsky Investments and Construction actually saw its EPS drop 28% per year.
Essentially, it doesn't seem likely that investors are focused on EPS. Because earnings per share don't seem to match up with the share price, we'll take a look at other metrics instead.
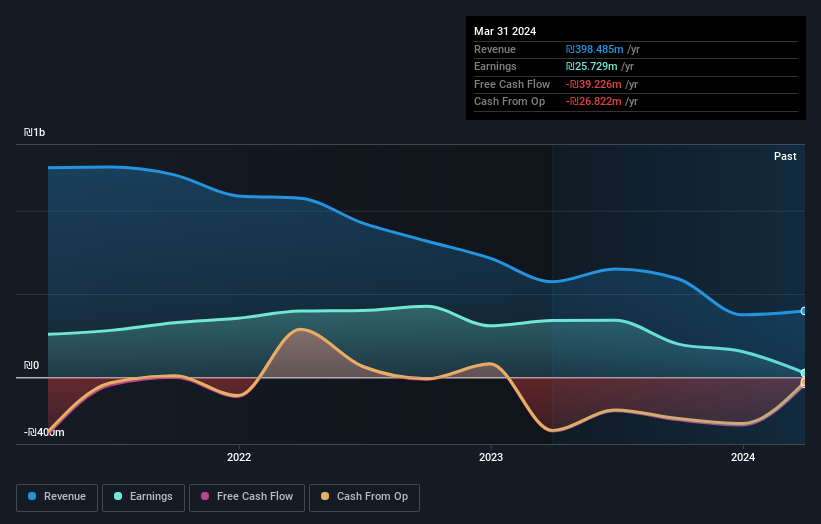
We doubt the modest 0.6% dividend yield is attracting many buyers to the stock. It is not great to see that revenue has dropped by 12% per year over five years. It certainly surprises us that the share price is up, but perhaps a closer examination of the data will yield answers.
The graphic below depicts how earnings and revenue have changed over time (unveil the exact values by clicking on the image).
Take a more thorough look at Prashkovsky Investments and Construction's financial health with this free report on its balance sheet.
What About Dividends?
As well as measuring the share price return, investors should also consider the total shareholder return (TSR). Whereas the share price return only reflects the change in the share price, the TSR includes the value of dividends (assuming they were reinvested) and the benefit of any discounted capital raising or spin-off. It's fair to say that the TSR gives a more complete picture for stocks that pay a dividend. In the case of Prashkovsky Investments and Construction, it has a TSR of 128% for the last 5 years. That exceeds its share price return that we previously mentioned. And there's no prize for guessing that the dividend payments largely explain the divergence!
A Different Perspective
Prashkovsky Investments and Construction shareholders are down 6.3% for the year (even including dividends), but the market itself is up 4.8%. However, keep in mind that even the best stocks will sometimes underperform the market over a twelve month period. Longer term investors wouldn't be so upset, since they would have made 18%, each year, over five years. It could be that the recent sell-off is an opportunity, so it may be worth checking the fundamental data for signs of a long term growth trend. While it is well worth considering the different impacts that market conditions can have on the share price, there are other factors that are even more important. Case in point: We've spotted 3 warning signs for Prashkovsky Investments and Construction you should be aware of, and 1 of them is potentially serious.
Of course Prashkovsky Investments and Construction may not be the best stock to buy. So you may wish to see this free collection of growth stocks.
Please note, the market returns quoted in this article reflect the market weighted average returns of stocks that currently trade on Israeli exchanges.
New: Manage All Your Stock Portfolios in One Place
We've created the ultimate portfolio companion for stock investors, and it's free.
• Connect an unlimited number of Portfolios and see your total in one currency
• Be alerted to new Warning Signs or Risks via email or mobile
• Track the Fair Value of your stocks
Have feedback on this article? Concerned about the content? Get in touch with us directly. Alternatively, email editorial-team (at) simplywallst.com.
This article by Simply Wall St is general in nature. We provide commentary based on historical data and analyst forecasts only using an unbiased methodology and our articles are not intended to be financial advice. It does not constitute a recommendation to buy or sell any stock, and does not take account of your objectives, or your financial situation. We aim to bring you long-term focused analysis driven by fundamental data. Note that our analysis may not factor in the latest price-sensitive company announcements or qualitative material. Simply Wall St has no position in any stocks mentioned.
Have feedback on this article? Concerned about the content? Get in touch with us directly. Alternatively, email editorial-team@simplywallst.com
About TASE:PRSK
Prashkovsky Investments and Construction
Prashkovsky Investments and Construction Ltd.
Low with poor track record.
