Stock Analysis
- Israel
- /
- Real Estate
- /
- TASE:DIMRI
Y.H. Dimri Construction & Development (TLV:DIMRI) stock performs better than its underlying earnings growth over last five years

For many, the main point of investing in the stock market is to achieve spectacular returns. And highest quality companies can see their share prices grow by huge amounts. To wit, the Y.H. Dimri Construction & Development Ltd (TLV:DIMRI) share price has soared 402% over five years. If that doesn't get you thinking about long term investing, we don't know what will. It's also good to see the share price up 18% over the last quarter. But this could be related to the strong market, which is up 7.4% in the last three months.
On the back of a solid 7-day performance, let's check what role the company's fundamentals have played in driving long term shareholder returns.
See our latest analysis for Y.H. Dimri Construction & Development
In his essay The Superinvestors of Graham-and-Doddsville Warren Buffett described how share prices do not always rationally reflect the value of a business. One imperfect but simple way to consider how the market perception of a company has shifted is to compare the change in the earnings per share (EPS) with the share price movement.
Over half a decade, Y.H. Dimri Construction & Development managed to grow its earnings per share at 5.8% a year. This EPS growth is slower than the share price growth of 38% per year, over the same period. So it's fair to assume the market has a higher opinion of the business than it did five years ago. That's not necessarily surprising considering the five-year track record of earnings growth.
The company's earnings per share (over time) is depicted in the image below (click to see the exact numbers).
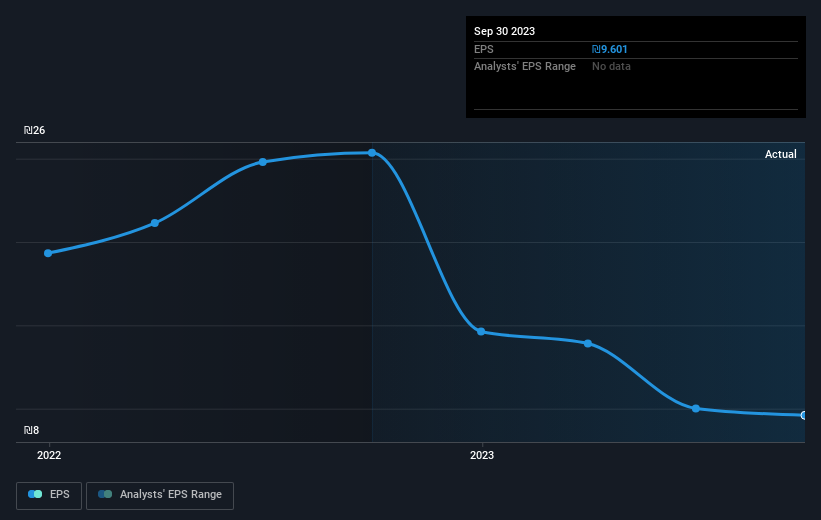
Dive deeper into Y.H. Dimri Construction & Development's key metrics by checking this interactive graph of Y.H. Dimri Construction & Development's earnings, revenue and cash flow.
What About Dividends?
As well as measuring the share price return, investors should also consider the total shareholder return (TSR). Whereas the share price return only reflects the change in the share price, the TSR includes the value of dividends (assuming they were reinvested) and the benefit of any discounted capital raising or spin-off. So for companies that pay a generous dividend, the TSR is often a lot higher than the share price return. As it happens, Y.H. Dimri Construction & Development's TSR for the last 5 years was 466%, which exceeds the share price return mentioned earlier. This is largely a result of its dividend payments!
A Different Perspective
It's nice to see that Y.H. Dimri Construction & Development shareholders have received a total shareholder return of 35% over the last year. And that does include the dividend. However, the TSR over five years, coming in at 41% per year, is even more impressive. It's always interesting to track share price performance over the longer term. But to understand Y.H. Dimri Construction & Development better, we need to consider many other factors. Like risks, for instance. Every company has them, and we've spotted 2 warning signs for Y.H. Dimri Construction & Development (of which 1 is significant!) you should know about.
For those who like to find winning investments this free list of growing companies with recent insider purchasing, could be just the ticket.
Please note, the market returns quoted in this article reflect the market weighted average returns of stocks that currently trade on Israeli exchanges.
Valuation is complex, but we're helping make it simple.
Find out whether Y.H. Dimri Construction & Development is potentially over or undervalued by checking out our comprehensive analysis, which includes fair value estimates, risks and warnings, dividends, insider transactions and financial health.
View the Free AnalysisHave feedback on this article? Concerned about the content? Get in touch with us directly. Alternatively, email editorial-team (at) simplywallst.com.
This article by Simply Wall St is general in nature. We provide commentary based on historical data and analyst forecasts only using an unbiased methodology and our articles are not intended to be financial advice. It does not constitute a recommendation to buy or sell any stock, and does not take account of your objectives, or your financial situation. We aim to bring you long-term focused analysis driven by fundamental data. Note that our analysis may not factor in the latest price-sensitive company announcements or qualitative material. Simply Wall St has no position in any stocks mentioned.
About TASE:DIMRI
Y.H. Dimri Construction & Development
Y.H. Dimri Construction & Development Ltd operates as a real estate company in Israel, Romania, and the Czech Republic.
Questionable track record with imperfect balance sheet.

