- Israel
- /
- Real Estate
- /
- TASE:AMOT
Amot Investments (TLV:AMOT) shareholders have endured a 11% loss from investing in the stock five years ago


For many, the main point of investing is to generate higher returns than the overall market. But in any portfolio, there will be mixed results between individual stocks. So we wouldn't blame long term Amot Investments Ltd. (TLV:AMOT) shareholders for doubting their decision to hold, with the stock down 36% over a half decade.
It's worthwhile assessing if the company's economics have been moving in lockstep with these underwhelming shareholder returns, or if there is some disparity between the two. So let's do just that.
See our latest analysis for Amot Investments
In his essay The Superinvestors of Graham-and-Doddsville Warren Buffett described how share prices do not always rationally reflect the value of a business. One flawed but reasonable way to assess how sentiment around a company has changed is to compare the earnings per share (EPS) with the share price.
During the five years over which the share price declined, Amot Investments' earnings per share (EPS) dropped by 3.0% each year. Readers should note that the share price has fallen faster than the EPS, at a rate of 8% per year, over the period. This implies that the market is more cautious about the business these days. The less favorable sentiment is reflected in its current P/E ratio of 10.95.
The company's earnings per share (over time) is depicted in the image below (click to see the exact numbers).
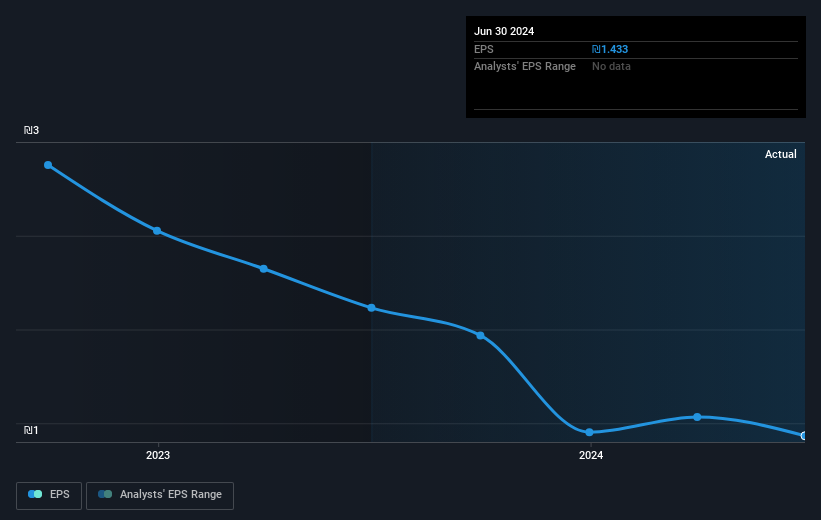
Before buying or selling a stock, we always recommend a close examination of historic growth trends, available here.
What About Dividends?
As well as measuring the share price return, investors should also consider the total shareholder return (TSR). The TSR is a return calculation that accounts for the value of cash dividends (assuming that any dividend received was reinvested) and the calculated value of any discounted capital raisings and spin-offs. It's fair to say that the TSR gives a more complete picture for stocks that pay a dividend. We note that for Amot Investments the TSR over the last 5 years was -11%, which is better than the share price return mentioned above. The dividends paid by the company have thusly boosted the total shareholder return.
A Different Perspective
Investors in Amot Investments had a tough year, with a total loss of 7.9% (including dividends), against a market gain of about 6.8%. Even the share prices of good stocks drop sometimes, but we want to see improvements in the fundamental metrics of a business, before getting too interested. Regrettably, last year's performance caps off a bad run, with the shareholders facing a total loss of 2% per year over five years. Generally speaking long term share price weakness can be a bad sign, though contrarian investors might want to research the stock in hope of a turnaround. It's always interesting to track share price performance over the longer term. But to understand Amot Investments better, we need to consider many other factors. Consider for instance, the ever-present spectre of investment risk. We've identified 4 warning signs with Amot Investments (at least 1 which is significant) , and understanding them should be part of your investment process.
If you are like me, then you will not want to miss this free list of undervalued small caps that insiders are buying.
Please note, the market returns quoted in this article reflect the market weighted average returns of stocks that currently trade on Israeli exchanges.
New: Manage All Your Stock Portfolios in One Place
We've created the ultimate portfolio companion for stock investors, and it's free.
• Connect an unlimited number of Portfolios and see your total in one currency
• Be alerted to new Warning Signs or Risks via email or mobile
• Track the Fair Value of your stocks
Have feedback on this article? Concerned about the content? Get in touch with us directly. Alternatively, email editorial-team (at) simplywallst.com.
This article by Simply Wall St is general in nature. We provide commentary based on historical data and analyst forecasts only using an unbiased methodology and our articles are not intended to be financial advice. It does not constitute a recommendation to buy or sell any stock, and does not take account of your objectives, or your financial situation. We aim to bring you long-term focused analysis driven by fundamental data. Note that our analysis may not factor in the latest price-sensitive company announcements or qualitative material. Simply Wall St has no position in any stocks mentioned.
About TASE:AMOT
Established dividend payer slight.

