- Israel
- /
- Real Estate
- /
- TASE:AFRE
Africa Israel Residences (TLV:AFRE) jumps 8.3% this week, though earnings growth is still tracking behind five-year shareholder returns


The most you can lose on any stock (assuming you don't use leverage) is 100% of your money. But on the bright side, if you buy shares in a high quality company at the right price, you can gain well over 100%. Long term Africa Israel Residences Ltd (TLV:AFRE) shareholders would be well aware of this, since the stock is up 173% in five years. It's even up 8.3% in the last week. The company reported its financial results recently; you can catch up on the latest numbers by reading our company report.
Since it's been a strong week for Africa Israel Residences shareholders, let's have a look at trend of the longer term fundamentals.
Check out our latest analysis for Africa Israel Residences
While markets are a powerful pricing mechanism, share prices reflect investor sentiment, not just underlying business performance. One flawed but reasonable way to assess how sentiment around a company has changed is to compare the earnings per share (EPS) with the share price.
During five years of share price growth, Africa Israel Residences achieved compound earnings per share (EPS) growth of 14% per year. This EPS growth is slower than the share price growth of 22% per year, over the same period. This suggests that market participants hold the company in higher regard, these days. That's not necessarily surprising considering the five-year track record of earnings growth.
You can see how EPS has changed over time in the image below (click on the chart to see the exact values).
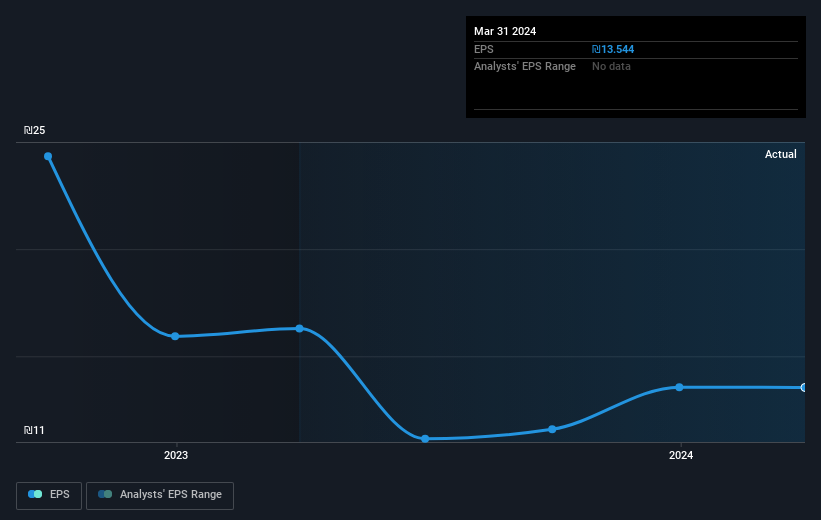
Dive deeper into Africa Israel Residences' key metrics by checking this interactive graph of Africa Israel Residences's earnings, revenue and cash flow.
What About Dividends?
When looking at investment returns, it is important to consider the difference between total shareholder return (TSR) and share price return. The TSR is a return calculation that accounts for the value of cash dividends (assuming that any dividend received was reinvested) and the calculated value of any discounted capital raisings and spin-offs. So for companies that pay a generous dividend, the TSR is often a lot higher than the share price return. We note that for Africa Israel Residences the TSR over the last 5 years was 228%, which is better than the share price return mentioned above. And there's no prize for guessing that the dividend payments largely explain the divergence!
A Different Perspective
We're pleased to report that Africa Israel Residences shareholders have received a total shareholder return of 38% over one year. Of course, that includes the dividend. That's better than the annualised return of 27% over half a decade, implying that the company is doing better recently. Someone with an optimistic perspective could view the recent improvement in TSR as indicating that the business itself is getting better with time. It's always interesting to track share price performance over the longer term. But to understand Africa Israel Residences better, we need to consider many other factors. Consider for instance, the ever-present spectre of investment risk. We've identified 4 warning signs with Africa Israel Residences (at least 2 which don't sit too well with us) , and understanding them should be part of your investment process.
We will like Africa Israel Residences better if we see some big insider buys. While we wait, check out this free list of undervalued stocks (mostly small caps) with considerable, recent, insider buying.
Please note, the market returns quoted in this article reflect the market weighted average returns of stocks that currently trade on Israeli exchanges.
New: Manage All Your Stock Portfolios in One Place
We've created the ultimate portfolio companion for stock investors, and it's free.
• Connect an unlimited number of Portfolios and see your total in one currency
• Be alerted to new Warning Signs or Risks via email or mobile
• Track the Fair Value of your stocks
Have feedback on this article? Concerned about the content? Get in touch with us directly. Alternatively, email editorial-team (at) simplywallst.com.
This article by Simply Wall St is general in nature. We provide commentary based on historical data and analyst forecasts only using an unbiased methodology and our articles are not intended to be financial advice. It does not constitute a recommendation to buy or sell any stock, and does not take account of your objectives, or your financial situation. We aim to bring you long-term focused analysis driven by fundamental data. Note that our analysis may not factor in the latest price-sensitive company announcements or qualitative material. Simply Wall St has no position in any stocks mentioned.
About TASE:AFRE
Africa Israel Residences
Engages in the development and sale of residential units under the Savyonim brand in Israel.
Proven track record with adequate balance sheet.

