
Advertisement
If You Had Bought Palram Industries (1990) (TLV:PLRM) Stock A Year Ago, You Could Pocket A 98% Gain Today
Passive investing in index funds can generate returns that roughly match the overall market. But if you pick the right individual stocks, you could make more than that. For example, the Palram Industries (1990) Ltd (TLV:PLRM) share price is up 98% in the last year, clearly besting the market decline of around 0.5% (not including dividends). If it can keep that out-performance up over the long term, investors will do very well! Looking back further, the stock price is 68% higher than it was three years ago.
See our latest analysis for Palram Industries (1990)
While the efficient markets hypothesis continues to be taught by some, it has been proven that markets are over-reactive dynamic systems, and investors are not always rational. One way to examine how market sentiment has changed over time is to look at the interaction between a company's share price and its earnings per share (EPS).
During the last year Palram Industries (1990) grew its earnings per share, moving from a loss to a profit.
When a company is just on the edge of profitability it can be well worth considering other metrics in order to more precisely gauge growth (and therefore understand share price movements).
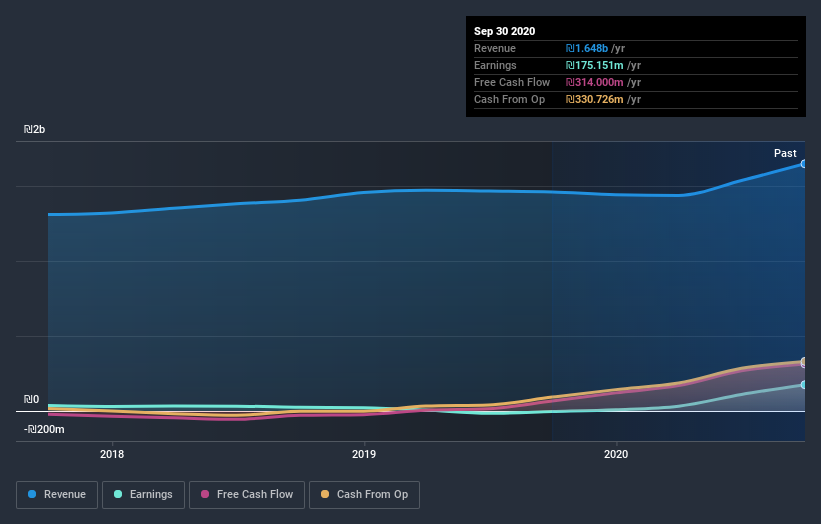
Absent any improvement, we don't think a thirst for dividends is pushing up the Palram Industries (1990)'s share price. It seems far more likely that the 13% boost to the revenue over the last year, is making the difference. Revenue growth often does precede earnings growth, so some investors might be willing to forgo profits today because they have their eyes fixed firmly on the future.
The graphic below depicts how earnings and revenue have changed over time (unveil the exact values by clicking on the image).
You can see how its balance sheet has strengthened (or weakened) over time in this free interactive graphic.
What About Dividends?
As well as measuring the share price return, investors should also consider the total shareholder return (TSR). Whereas the share price return only reflects the change in the share price, the TSR includes the value of dividends (assuming they were reinvested) and the benefit of any discounted capital raising or spin-off. It's fair to say that the TSR gives a more complete picture for stocks that pay a dividend. As it happens, Palram Industries (1990)'s TSR for the last year was 105%, which exceeds the share price return mentioned earlier. And there's no prize for guessing that the dividend payments largely explain the divergence!
A Different Perspective
It's good to see that Palram Industries (1990) has rewarded shareholders with a total shareholder return of 105% in the last twelve months. And that does include the dividend. Since the one-year TSR is better than the five-year TSR (the latter coming in at 12% per year), it would seem that the stock's performance has improved in recent times. In the best case scenario, this may hint at some real business momentum, implying that now could be a great time to delve deeper. I find it very interesting to look at share price over the long term as a proxy for business performance. But to truly gain insight, we need to consider other information, too. For instance, we've identified 1 warning sign for Palram Industries (1990) that you should be aware of.
We will like Palram Industries (1990) better if we see some big insider buys. While we wait, check out this free list of growing companies with considerable, recent, insider buying.
Please note, the market returns quoted in this article reflect the market weighted average returns of stocks that currently trade on IL exchanges.
If you’re looking to trade Palram Industries (1990), open an account with the lowest-cost* platform trusted by professionals, Interactive Brokers. Their clients from over 200 countries and territories trade stocks, options, futures, forex, bonds and funds worldwide from a single integrated account. Promoted
New: Manage All Your Stock Portfolios in One Place
We've created the ultimate portfolio companion for stock investors, and it's free.
• Connect an unlimited number of Portfolios and see your total in one currency
• Be alerted to new Warning Signs or Risks via email or mobile
• Track the Fair Value of your stocks
This article by Simply Wall St is general in nature. It does not constitute a recommendation to buy or sell any stock, and does not take account of your objectives, or your financial situation. We aim to bring you long-term focused analysis driven by fundamental data. Note that our analysis may not factor in the latest price-sensitive company announcements or qualitative material. Simply Wall St has no position in any stocks mentioned.
*Interactive Brokers Rated Lowest Cost Broker by StockBrokers.com Annual Online Review 2020
Have feedback on this article? Concerned about the content? Get in touch with us directly. Alternatively, email editorial-team (at) simplywallst.com.
About TASE:PLRM
Palram Industries (1990)
Operates as a manufacturer of extruded thermoplastic sheets and panel systems in Israel and internationally.
Flawless balance sheet established dividend payer.
Similar Companies
Market Insights

Advertisement
Community Narratives
MicroVision will explode future revenue by 380.37% with a vision towards success
Fair Value US$60|98.4% undervalued
TH
Community Contributor
The Indispensable Artery for a New North American Economy
Fair Value CA$132.87|1.6% undervalued
TI
Community Contributor
Recently Updated Narratives
BE


Bejgal on MINISO Group Holding ·
MINISO's fair value is projected at 26.69 with an anticipated PE ratio shift of 20x
Fair Value:US$26.6928.0% undervalued
44 followersusers have followed this narrative
3 commentsusers have commented on this narrative
0 likesusers have liked this narrative
TI


TickerTickle on Oracle ·
The Quiet Giant That Became AI’s Power Grid
Fair Value:US$389.8149.5% undervalued
7 followersusers have followed this narrative
1 commentusers have commented on this narrative
0 likesusers have liked this narrative
AU

AuCA on Nova Ljubljanska Banka d.d ·
Nova Ljubljanska Banka d.d will expect a 11.2% revenue boost driving future growth
Fair Value:€20916.3% undervalued
23 followersusers have followed this narrative
3 commentsusers have commented on this narrative
0 likesusers have liked this narrative
Popular Narratives
OS


oscargarcia on Alphabet ·
The company that turned a verb into a global necessity and basically runs the modern internet, digital ads, smartphones, maps, and AI.
Fair Value:US$3404.9% undervalued
135 followersusers have followed this narrative
6 commentsusers have commented on this narrative
18 likesusers have liked this narrative
TH

TheWallstreetKing on MicroVision ·
MicroVision will explode future revenue by 380.37% with a vision towards success
Fair Value:US$6098.4% undervalued
87 followersusers have followed this narrative
11 commentsusers have commented on this narrative
18 likesusers have liked this narrative
AN


AnalystConsensusTarget on NVIDIA ·
NVDA: Expanding AI Demand Will Drive Major Data Center Investments Through 2026
Fair Value:US$232.7923.6% undervalued
923 followersusers have followed this narrative
5 commentsusers have commented on this narrative
22 likesusers have liked this narrative