
Advertisement
Shareholders Of N.R. Spuntech Industries (TLV:SPNTC) Must Be Happy With Their 88% Return
The simplest way to invest in stocks is to buy exchange traded funds. But one can do better than that by picking better than average stocks (as part of a diversified portfolio). For example, the N.R. Spuntech Industries Ltd. (TLV:SPNTC) share price is up 62% in the last year, clearly besting the market return of around 48% (not including dividends). So that should have shareholders smiling. On the other hand, longer term shareholders have had a tougher run, with the stock falling 6.4% in three years.
View our latest analysis for N.R. Spuntech Industries
There is no denying that markets are sometimes efficient, but prices do not always reflect underlying business performance. By comparing earnings per share (EPS) and share price changes over time, we can get a feel for how investor attitudes to a company have morphed over time.
During the last year N.R. Spuntech Industries grew its earnings per share (EPS) by 237%. This EPS growth is significantly higher than the 62% increase in the share price. So it seems like the market has cooled on N.R. Spuntech Industries, despite the growth. Interesting. This cautious sentiment is reflected in its (fairly low) P/E ratio of 7.05.
The company's earnings per share (over time) is depicted in the image below (click to see the exact numbers).
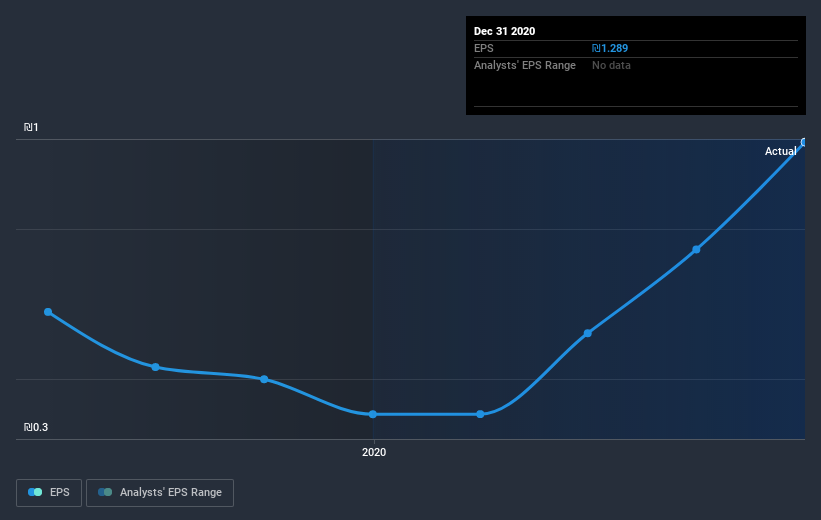
Dive deeper into N.R. Spuntech Industries' key metrics by checking this interactive graph of N.R. Spuntech Industries's earnings, revenue and cash flow.
What About Dividends?
It is important to consider the total shareholder return, as well as the share price return, for any given stock. The TSR is a return calculation that accounts for the value of cash dividends (assuming that any dividend received was reinvested) and the calculated value of any discounted capital raisings and spin-offs. So for companies that pay a generous dividend, the TSR is often a lot higher than the share price return. In the case of N.R. Spuntech Industries, it has a TSR of 88% for the last year. That exceeds its share price return that we previously mentioned. And there's no prize for guessing that the dividend payments largely explain the divergence!
A Different Perspective
It's nice to see that N.R. Spuntech Industries shareholders have received a total shareholder return of 88% over the last year. That's including the dividend. That certainly beats the loss of about 6% per year over the last half decade. This makes us a little wary, but the business might have turned around its fortunes. While it is well worth considering the different impacts that market conditions can have on the share price, there are other factors that are even more important. Case in point: We've spotted 3 warning signs for N.R. Spuntech Industries you should be aware of, and 1 of them shouldn't be ignored.
But note: N.R. Spuntech Industries may not be the best stock to buy. So take a peek at this free list of interesting companies with past earnings growth (and further growth forecast).
Please note, the market returns quoted in this article reflect the market weighted average returns of stocks that currently trade on IL exchanges.
When trading N.R. Spuntech Industries or any other investment, use the platform considered by many to be the Professional's Gateway to the Worlds Market, Interactive Brokers. You get the lowest-cost* trading on stocks, options, futures, forex, bonds and funds worldwide from a single integrated account. Promoted
Valuation is complex, but we're here to simplify it.
Discover if N.R. Spuntech Industries might be undervalued or overvalued with our detailed analysis, featuring fair value estimates, potential risks, dividends, insider trades, and its financial condition.
Access Free AnalysisThis article by Simply Wall St is general in nature. It does not constitute a recommendation to buy or sell any stock, and does not take account of your objectives, or your financial situation. We aim to bring you long-term focused analysis driven by fundamental data. Note that our analysis may not factor in the latest price-sensitive company announcements or qualitative material. Simply Wall St has no position in any stocks mentioned.
*Interactive Brokers Rated Lowest Cost Broker by StockBrokers.com Annual Online Review 2020
Have feedback on this article? Concerned about the content? Get in touch with us directly. Alternatively, email editorial-team (at) simplywallst.com.
About TASE:SPNTC
N.R. Spuntech Industries
Produces, markets, and sells non-woven fabrics in Israel, the United States, Canada, Europe, Central and Southern America, and internationally.
Average dividend payer with slight risk.
Similar Companies
Market Insights

Advertisement
Community Narratives
MicroVision will explode future revenue by 380.37% with a vision towards success
Fair Value US$60.00|98.4% undervalued
TH
Community Contributor
The Indispensable Artery for a New North American Economy
Fair Value CA$132.87|1.3% undervalued
TI
Community Contributor