Stock Analysis
Investors three-year losses continue as Strauss Group (TLV:STRS) dips a further 4.6% this week, earnings continue to decline


Many investors define successful investing as beating the market average over the long term. But its virtually certain that sometimes you will buy stocks that fall short of the market average returns. We regret to report that long term Strauss Group Ltd. (TLV:STRS) shareholders have had that experience, with the share price dropping 29% in three years, versus a market return of about 23%. Shareholders have had an even rougher run lately, with the share price down 12% in the last 90 days. Of course, this share price action may well have been influenced by the 8.9% decline in the broader market, throughout the period.
Given the past week has been tough on shareholders, let's investigate the fundamentals and see what we can learn.
Check out our latest analysis for Strauss Group
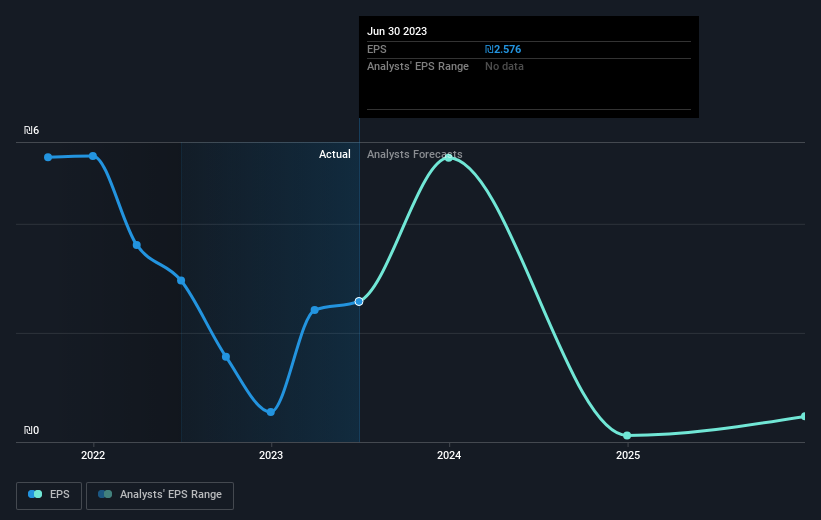
While the efficient markets hypothesis continues to be taught by some, it has been proven that markets are over-reactive dynamic systems, and investors are not always rational. One imperfect but simple way to consider how the market perception of a company has shifted is to compare the change in the earnings per share (EPS) with the share price movement.
Strauss Group saw its EPS decline at a compound rate of 18% per year, over the last three years. This fall in the EPS is worse than the 11% compound annual share price fall. This suggests that the market retains some optimism around long term earnings stability, despite past EPS declines.
You can see below how EPS has changed over time (discover the exact values by clicking on the image).
This free interactive report on Strauss Group's earnings, revenue and cash flow is a great place to start, if you want to investigate the stock further.
What About The Total Shareholder Return (TSR)?
Investors should note that there's a difference between Strauss Group's total shareholder return (TSR) and its share price change, which we've covered above. The TSR is a return calculation that accounts for the value of cash dividends (assuming that any dividend received was reinvested) and the calculated value of any discounted capital raisings and spin-offs. Dividends have been really beneficial for Strauss Group shareholders, and that cash payout explains why its total shareholder loss of 24%, over the last 3 years, isn't as bad as the share price return.
A Different Perspective
We regret to report that Strauss Group shareholders are down 19% for the year. Unfortunately, that's worse than the broader market decline of 16%. However, it could simply be that the share price has been impacted by broader market jitters. It might be worth keeping an eye on the fundamentals, in case there's a good opportunity. Unfortunately, last year's performance may indicate unresolved challenges, given that it was worse than the annualised loss of 0.7% over the last half decade. Generally speaking long term share price weakness can be a bad sign, though contrarian investors might want to research the stock in hope of a turnaround. It's always interesting to track share price performance over the longer term. But to understand Strauss Group better, we need to consider many other factors. Take risks, for example - Strauss Group has 2 warning signs we think you should be aware of.
Of course Strauss Group may not be the best stock to buy. So you may wish to see this free collection of growth stocks.
Please note, the market returns quoted in this article reflect the market weighted average returns of stocks that currently trade on Israeli exchanges.
New: Manage All Your Stock Portfolios in One Place
We've created the ultimate portfolio companion for stock investors, and it's free.
• Connect an unlimited number of Portfolios and see your total in one currency
• Be alerted to new Warning Signs or Risks via email or mobile
• Track the Fair Value of your stocks
Have feedback on this article? Concerned about the content? Get in touch with us directly. Alternatively, email editorial-team (at) simplywallst.com.
This article by Simply Wall St is general in nature. We provide commentary based on historical data and analyst forecasts only using an unbiased methodology and our articles are not intended to be financial advice. It does not constitute a recommendation to buy or sell any stock, and does not take account of your objectives, or your financial situation. We aim to bring you long-term focused analysis driven by fundamental data. Note that our analysis may not factor in the latest price-sensitive company announcements or qualitative material. Simply Wall St has no position in any stocks mentioned.
About TASE:STRS
Strauss Group
Develops, manufactures, markets, sells, and distributes various food and beverage products in Israel, North America, Brazil, Europe, and internationally.
Adequate balance sheet slight.
