Stock Analysis
- Israel
- /
- Food and Staples Retail
- /
- TASE:VCTR
The three-year shareholder returns and company earnings persist lower as Victory Supermarket Chain (TLV:VCTR) stock falls a further 12% in past week


Investing in stocks inevitably means buying into some companies that perform poorly. But the last three years have been particularly tough on longer term Victory Supermarket Chain Ltd (TLV:VCTR) shareholders. Regrettably, they have had to cope with a 58% drop in the share price over that period. And more recent buyers are having a tough time too, with a drop of 39% in the last year. Furthermore, it's down 13% in about a quarter. That's not much fun for holders. This could be related to the recent financial results - you can catch up on the most recent data by reading our company report.
With the stock having lost 12% in the past week, it's worth taking a look at business performance and seeing if there's any red flags.
View our latest analysis for Victory Supermarket Chain
To quote Buffett, 'Ships will sail around the world but the Flat Earth Society will flourish. There will continue to be wide discrepancies between price and value in the marketplace...' One way to examine how market sentiment has changed over time is to look at the interaction between a company's share price and its earnings per share (EPS).
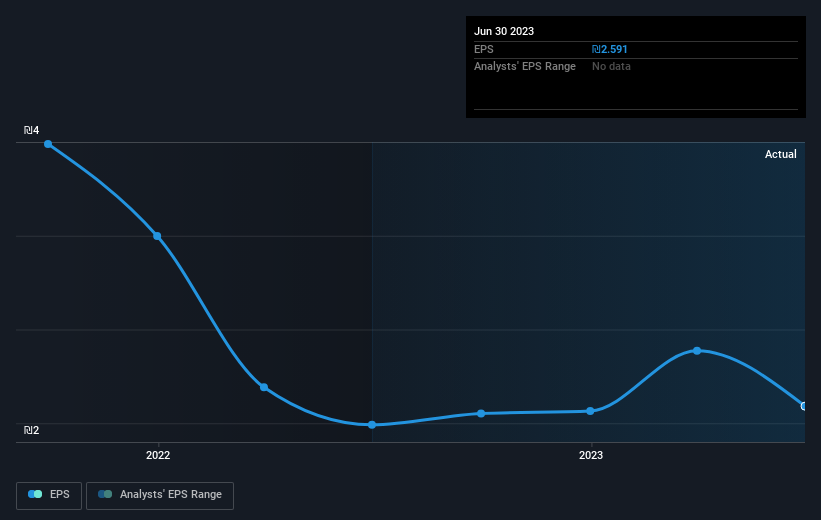
Victory Supermarket Chain saw its EPS decline at a compound rate of 6.8% per year, over the last three years. The share price decline of 25% is actually steeper than the EPS slippage. So it seems the market was too confident about the business, in the past.
You can see below how EPS has changed over time (discover the exact values by clicking on the image).
This free interactive report on Victory Supermarket Chain's earnings, revenue and cash flow is a great place to start, if you want to investigate the stock further.
What About Dividends?
When looking at investment returns, it is important to consider the difference between total shareholder return (TSR) and share price return. Whereas the share price return only reflects the change in the share price, the TSR includes the value of dividends (assuming they were reinvested) and the benefit of any discounted capital raising or spin-off. Arguably, the TSR gives a more comprehensive picture of the return generated by a stock. In the case of Victory Supermarket Chain, it has a TSR of -56% for the last 3 years. That exceeds its share price return that we previously mentioned. And there's no prize for guessing that the dividend payments largely explain the divergence!
A Different Perspective
While the broader market lost about 16% in the twelve months, Victory Supermarket Chain shareholders did even worse, losing 37% (even including dividends). Having said that, it's inevitable that some stocks will be oversold in a falling market. The key is to keep your eyes on the fundamental developments. Regrettably, last year's performance caps off a bad run, with the shareholders facing a total loss of 2% per year over five years. Generally speaking long term share price weakness can be a bad sign, though contrarian investors might want to research the stock in hope of a turnaround. I find it very interesting to look at share price over the long term as a proxy for business performance. But to truly gain insight, we need to consider other information, too. For example, we've discovered 1 warning sign for Victory Supermarket Chain that you should be aware of before investing here.
If you like to buy stocks alongside management, then you might just love this free list of companies. (Hint: insiders have been buying them).
Please note, the market returns quoted in this article reflect the market weighted average returns of stocks that currently trade on Israeli exchanges.
New: Manage All Your Stock Portfolios in One Place
We've created the ultimate portfolio companion for stock investors, and it's free.
• Connect an unlimited number of Portfolios and see your total in one currency
• Be alerted to new Warning Signs or Risks via email or mobile
• Track the Fair Value of your stocks
Have feedback on this article? Concerned about the content? Get in touch with us directly. Alternatively, email editorial-team (at) simplywallst.com.
This article by Simply Wall St is general in nature. We provide commentary based on historical data and analyst forecasts only using an unbiased methodology and our articles are not intended to be financial advice. It does not constitute a recommendation to buy or sell any stock, and does not take account of your objectives, or your financial situation. We aim to bring you long-term focused analysis driven by fundamental data. Note that our analysis may not factor in the latest price-sensitive company announcements or qualitative material. Simply Wall St has no position in any stocks mentioned.
About TASE:VCTR
Excellent balance sheet, good value and pays a dividend.
