Stock Analysis
- Israel
- /
- Food and Staples Retail
- /
- TASE:SAE
Shufersal's (TLV:SAE) 763% YoY earnings expansion surpassed the shareholder returns over the past year


Passive investing in index funds can generate returns that roughly match the overall market. But if you pick the right individual stocks, you could make more than that. To wit, the Shufersal Ltd (TLV:SAE) share price is 41% higher than it was a year ago, much better than the market return of around 1.1% (not including dividends) in the same period. If it can keep that out-performance up over the long term, investors will do very well! However, the stock hasn't done so well in the longer term, with the stock only up 5.3% in three years.
On the back of a solid 7-day performance, let's check what role the company's fundamentals have played in driving long term shareholder returns.
See our latest analysis for Shufersal
To quote Buffett, 'Ships will sail around the world but the Flat Earth Society will flourish. There will continue to be wide discrepancies between price and value in the marketplace...' By comparing earnings per share (EPS) and share price changes over time, we can get a feel for how investor attitudes to a company have morphed over time.
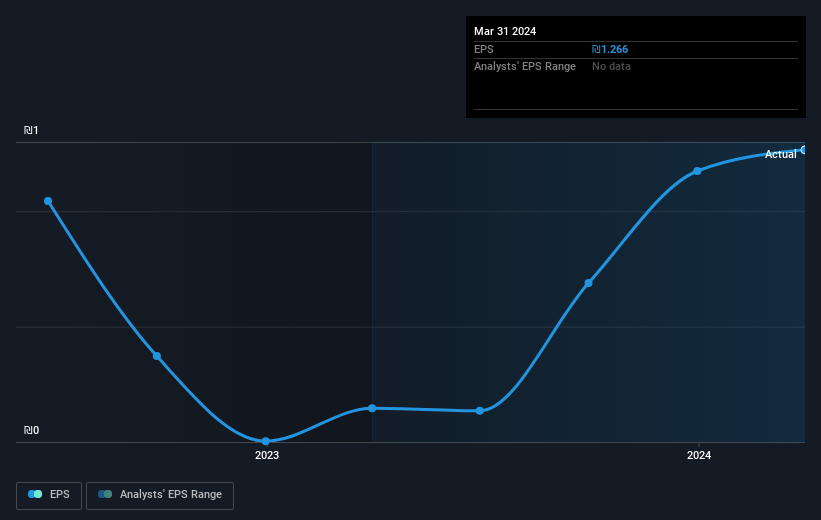
During the last year Shufersal saw its earnings per share (EPS) increase strongly. We don't think the exact number is a good guide to the sustainable growth rate, but we do think this sort of increase is impressive. So we're unsurprised to see the share price gaining ground. Strong growth like this can be evidence of a fundamental inflection point in the business, making it a good time to investigate the stock more closely.
You can see how EPS has changed over time in the image below (click on the chart to see the exact values).
Dive deeper into Shufersal's key metrics by checking this interactive graph of Shufersal's earnings, revenue and cash flow.
What About Dividends?
As well as measuring the share price return, investors should also consider the total shareholder return (TSR). Whereas the share price return only reflects the change in the share price, the TSR includes the value of dividends (assuming they were reinvested) and the benefit of any discounted capital raising or spin-off. So for companies that pay a generous dividend, the TSR is often a lot higher than the share price return. We note that for Shufersal the TSR over the last 1 year was 45%, which is better than the share price return mentioned above. And there's no prize for guessing that the dividend payments largely explain the divergence!
A Different Perspective
We're pleased to report that Shufersal shareholders have received a total shareholder return of 45% over one year. And that does include the dividend. That's better than the annualised return of 4% over half a decade, implying that the company is doing better recently. Given the share price momentum remains strong, it might be worth taking a closer look at the stock, lest you miss an opportunity. I find it very interesting to look at share price over the long term as a proxy for business performance. But to truly gain insight, we need to consider other information, too. Even so, be aware that Shufersal is showing 2 warning signs in our investment analysis , and 1 of those shouldn't be ignored...
Of course Shufersal may not be the best stock to buy. So you may wish to see this free collection of growth stocks.
Please note, the market returns quoted in this article reflect the market weighted average returns of stocks that currently trade on Israeli exchanges.
New: Manage All Your Stock Portfolios in One Place
We've created the ultimate portfolio companion for stock investors, and it's free.
• Connect an unlimited number of Portfolios and see your total in one currency
• Be alerted to new Warning Signs or Risks via email or mobile
• Track the Fair Value of your stocks
Have feedback on this article? Concerned about the content? Get in touch with us directly. Alternatively, email editorial-team (at) simplywallst.com.
This article by Simply Wall St is general in nature. We provide commentary based on historical data and analyst forecasts only using an unbiased methodology and our articles are not intended to be financial advice. It does not constitute a recommendation to buy or sell any stock, and does not take account of your objectives, or your financial situation. We aim to bring you long-term focused analysis driven by fundamental data. Note that our analysis may not factor in the latest price-sensitive company announcements or qualitative material. Simply Wall St has no position in any stocks mentioned.
Have feedback on this article? Concerned about the content? Get in touch with us directly. Alternatively, email editorial-team@simplywallst.com
About TASE:SAE
Shufersal
Operates a chain of supermarkets under the Shufersal brand name in Israel.
Average dividend payer with acceptable track record.
