
Advertisement
- Israel
- /
- Consumer Durables
- /
- TASE:ECP
A Piece Of The Puzzle Missing From Electra Consumer Products (1970) Ltd's (TLV:ECP) Share Price
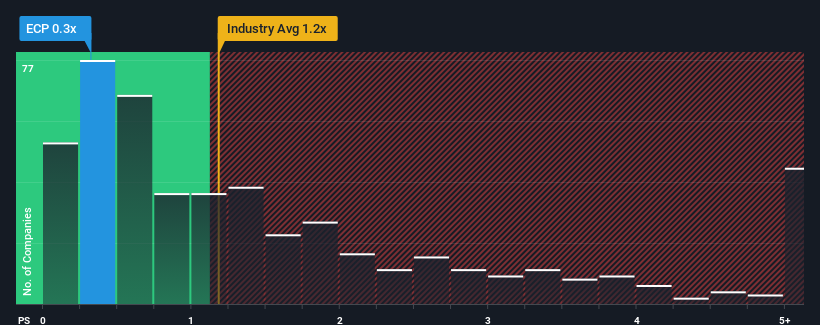
Electra Consumer Products (1970) Ltd's (TLV:ECP) price-to-sales (or "P/S") ratio of 0.3x may look like a very appealing investment opportunity when you consider close to half the companies in the Consumer Durables industry in Israel have P/S ratios greater than 2.4x. Although, it's not wise to just take the P/S at face value as there may be an explanation why it's so limited.
See our latest analysis for Electra Consumer Products (1970)
What Does Electra Consumer Products (1970)'s P/S Mean For Shareholders?
The recent revenue growth at Electra Consumer Products (1970) would have to be considered satisfactory if not spectacular. One possibility is that the P/S ratio is low because investors think this good revenue growth might actually underperform the broader industry in the near future. Those who are bullish on Electra Consumer Products (1970) will be hoping that this isn't the case, so that they can pick up the stock at a lower valuation.
Although there are no analyst estimates available for Electra Consumer Products (1970), take a look at this free data-rich visualisation to see how the company stacks up on earnings, revenue and cash flow.Is There Any Revenue Growth Forecasted For Electra Consumer Products (1970)?
The only time you'd be truly comfortable seeing a P/S as depressed as Electra Consumer Products (1970)'s is when the company's growth is on track to lag the industry decidedly.
Retrospectively, the last year delivered a decent 5.2% gain to the company's revenues. This was backed up an excellent period prior to see revenue up by 170% in total over the last three years. Therefore, it's fair to say the revenue growth recently has been superb for the company.
When compared to the industry's one-year growth forecast of 8.2%, the most recent medium-term revenue trajectory is noticeably more alluring
With this in mind, we find it intriguing that Electra Consumer Products (1970)'s P/S isn't as high compared to that of its industry peers. It looks like most investors are not convinced the company can maintain its recent growth rates.
What We Can Learn From Electra Consumer Products (1970)'s P/S?
Generally, our preference is to limit the use of the price-to-sales ratio to establishing what the market thinks about the overall health of a company.
Our examination of Electra Consumer Products (1970) revealed its three-year revenue trends aren't boosting its P/S anywhere near as much as we would have predicted, given they look better than current industry expectations. Potential investors that are sceptical over continued revenue performance may be preventing the P/S ratio from matching previous strong performance. While recent revenue trends over the past medium-term suggest that the risk of a price decline is low, investors appear to perceive a likelihood of revenue fluctuations in the future.
We don't want to rain on the parade too much, but we did also find 3 warning signs for Electra Consumer Products (1970) (2 don't sit too well with us!) that you need to be mindful of.
It's important to make sure you look for a great company, not just the first idea you come across. So if growing profitability aligns with your idea of a great company, take a peek at this free list of interesting companies with strong recent earnings growth (and a low P/E).
Valuation is complex, but we're here to simplify it.
Discover if Electra Consumer Products (1970) might be undervalued or overvalued with our detailed analysis, featuring fair value estimates, potential risks, dividends, insider trades, and its financial condition.
Access Free AnalysisHave feedback on this article? Concerned about the content? Get in touch with us directly. Alternatively, email editorial-team (at) simplywallst.com.
This article by Simply Wall St is general in nature. We provide commentary based on historical data and analyst forecasts only using an unbiased methodology and our articles are not intended to be financial advice. It does not constitute a recommendation to buy or sell any stock, and does not take account of your objectives, or your financial situation. We aim to bring you long-term focused analysis driven by fundamental data. Note that our analysis may not factor in the latest price-sensitive company announcements or qualitative material. Simply Wall St has no position in any stocks mentioned.
About TASE:ECP
Electra Consumer Products (1970)
Manufactures, imports, exports, distributes, sells, and services for various consumer electrical products in Israel.
Acceptable track record with low risk.
Market Insights

Advertisement
Community Narratives
MicroVision will explode future revenue by 380.37% with a vision towards success
Fair Value US$60.00|98.4% undervalued
TH
Community Contributor
The Indispensable Artery for a New North American Economy
Fair Value CA$132.87|1.3% undervalued
TI
Community Contributor