
Advertisement
Legendary fund manager Li Lu (who Charlie Munger backed) once said, 'The biggest investment risk is not the volatility of prices, but whether you will suffer a permanent loss of capital.' When we think about how risky a company is, we always like to look at its use of debt, since debt overload can lead to ruin. As with many other companies Hilan Ltd. (TLV:HLAN) makes use of debt. But the real question is whether this debt is making the company risky.
When Is Debt Dangerous?
Debt and other liabilities become risky for a business when it cannot easily fulfill those obligations, either with free cash flow or by raising capital at an attractive price. Ultimately, if the company can't fulfill its legal obligations to repay debt, shareholders could walk away with nothing. However, a more frequent (but still costly) occurrence is where a company must issue shares at bargain-basement prices, permanently diluting shareholders, just to shore up its balance sheet. Of course, debt can be an important tool in businesses, particularly capital heavy businesses. When we think about a company's use of debt, we first look at cash and debt together.
View our latest analysis for Hilan
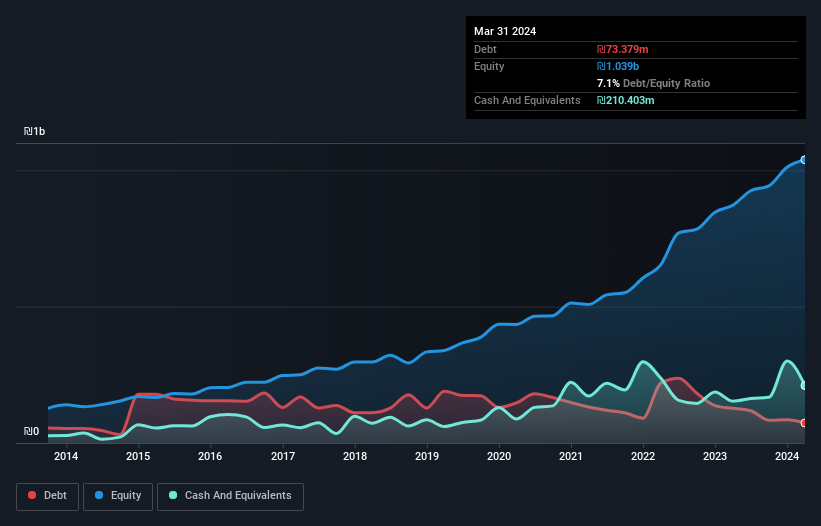
How Much Debt Does Hilan Carry?
As you can see below, Hilan had ₪73.4m of debt at March 2024, down from ₪127.1m a year prior. However, its balance sheet shows it holds ₪210.4m in cash, so it actually has ₪137.0m net cash.
How Healthy Is Hilan's Balance Sheet?
We can see from the most recent balance sheet that Hilan had liabilities of ₪941.6m falling due within a year, and liabilities of ₪328.0m due beyond that. Offsetting this, it had ₪210.4m in cash and ₪969.8m in receivables that were due within 12 months. So it has liabilities totalling ₪89.3m more than its cash and near-term receivables, combined.
This state of affairs indicates that Hilan's balance sheet looks quite solid, as its total liabilities are just about equal to its liquid assets. So while it's hard to imagine that the ₪4.74b company is struggling for cash, we still think it's worth monitoring its balance sheet. While it does have liabilities worth noting, Hilan also has more cash than debt, so we're pretty confident it can manage its debt safely.
Another good sign is that Hilan has been able to increase its EBIT by 20% in twelve months, making it easier to pay down debt. There's no doubt that we learn most about debt from the balance sheet. But it is Hilan's earnings that will influence how the balance sheet holds up in the future. So if you're keen to discover more about its earnings, it might be worth checking out this graph of its long term earnings trend.
Finally, a business needs free cash flow to pay off debt; accounting profits just don't cut it. Hilan may have net cash on the balance sheet, but it is still interesting to look at how well the business converts its earnings before interest and tax (EBIT) to free cash flow, because that will influence both its need for, and its capacity to manage debt. During the last three years, Hilan generated free cash flow amounting to a very robust 93% of its EBIT, more than we'd expect. That positions it well to pay down debt if desirable to do so.
Summing Up
We could understand if investors are concerned about Hilan's liabilities, but we can be reassured by the fact it has has net cash of ₪137.0m. The cherry on top was that in converted 93% of that EBIT to free cash flow, bringing in ₪244m. So we don't think Hilan's use of debt is risky. Above most other metrics, we think its important to track how fast earnings per share is growing, if at all. If you've also come to that realization, you're in luck, because today you can view this interactive graph of Hilan's earnings per share history for free.
At the end of the day, it's often better to focus on companies that are free from net debt. You can access our special list of such companies (all with a track record of profit growth). It's free.
Valuation is complex, but we're here to simplify it.
Discover if Hilan might be undervalued or overvalued with our detailed analysis, featuring fair value estimates, potential risks, dividends, insider trades, and its financial condition.
Access Free AnalysisHave feedback on this article? Concerned about the content? Get in touch with us directly. Alternatively, email editorial-team (at) simplywallst.com.
This article by Simply Wall St is general in nature. We provide commentary based on historical data and analyst forecasts only using an unbiased methodology and our articles are not intended to be financial advice. It does not constitute a recommendation to buy or sell any stock, and does not take account of your objectives, or your financial situation. We aim to bring you long-term focused analysis driven by fundamental data. Note that our analysis may not factor in the latest price-sensitive company announcements or qualitative material. Simply Wall St has no position in any stocks mentioned.
Have feedback on this article? Concerned about the content? Get in touch with us directly. Alternatively, email editorial-team@simplywallst.com
About TASE:HLAN
Hilan
A software as a service (SaaS) provider, develops solutions for management of enterprise human capital in Israel.
Flawless balance sheet with proven track record.
Similar Companies
Market Insights

Advertisement
Community Narratives
MicroVision will explode future revenue by 380.37% with a vision towards success
Fair Value US$60.00|98.5% undervalued
TH
Community Contributor
The Indispensable Artery for a New North American Economy
Fair Value CA$132.87|2.3% undervalued
TI
Community Contributor