
Advertisement
- Israel
- /
- Trade Distributors
- /
- TASE:SCOP
A Look At The Intrinsic Value Of Scope Metals Group Ltd. (TLV:SCOP)
Key Insights
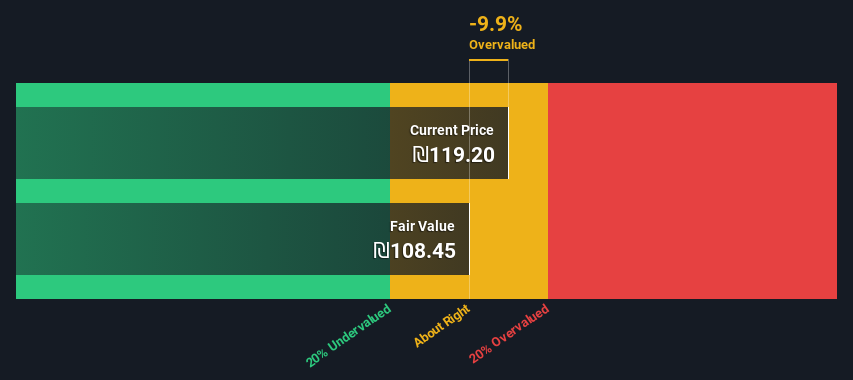
- The projected fair value for Scope Metals Group is ₪108 based on 2 Stage Free Cash Flow to Equity
- Current share price of ₪119 suggests Scope Metals Group is potentially trading close to its fair value
- When compared to theindustry average discount of -16%, Scope Metals Group's competitors seem to be trading at a greater premium to fair value
Today we will run through one way of estimating the intrinsic value of Scope Metals Group Ltd. (TLV:SCOP) by taking the forecast future cash flows of the company and discounting them back to today's value. One way to achieve this is by employing the Discounted Cash Flow (DCF) model. It may sound complicated, but actually it is quite simple!
We generally believe that a company's value is the present value of all of the cash it will generate in the future. However, a DCF is just one valuation metric among many, and it is not without flaws. Anyone interested in learning a bit more about intrinsic value should have a read of the Simply Wall St analysis model.
View our latest analysis for Scope Metals Group
The Calculation
We're using the 2-stage growth model, which simply means we take in account two stages of company's growth. In the initial period the company may have a higher growth rate and the second stage is usually assumed to have a stable growth rate. To start off with, we need to estimate the next ten years of cash flows. Seeing as no analyst estimates of free cash flow are available to us, we have extrapolate the previous free cash flow (FCF) from the company's last reported value. We assume companies with shrinking free cash flow will slow their rate of shrinkage, and that companies with growing free cash flow will see their growth rate slow, over this period. We do this to reflect that growth tends to slow more in the early years than it does in later years.
Generally we assume that a dollar today is more valuable than a dollar in the future, and so the sum of these future cash flows is then discounted to today's value:
10-year free cash flow (FCF) forecast
| 2024 | 2025 | 2026 | 2027 | 2028 | 2029 | 2030 | 2031 | 2032 | 2033 | |
| Levered FCF (₪, Millions) | ₪114.9m | ₪116.4m | ₪118.1m | ₪120.0m | ₪122.0m | ₪124.0m | ₪126.2m | ₪128.4m | ₪130.7m | ₪133.0m |
| Growth Rate Estimate Source | Est @ 1.12% | Est @ 1.33% | Est @ 1.47% | Est @ 1.57% | Est @ 1.65% | Est @ 1.69% | Est @ 1.73% | Est @ 1.75% | Est @ 1.77% | Est @ 1.78% |
| Present Value (₪, Millions) Discounted @ 10% | ₪104 | ₪95.6 | ₪87.9 | ₪80.9 | ₪74.5 | ₪68.7 | ₪63.3 | ₪58.4 | ₪53.8 | ₪49.7 |
("Est" = FCF growth rate estimated by Simply Wall St)
Present Value of 10-year Cash Flow (PVCF) = ₪737m
After calculating the present value of future cash flows in the initial 10-year period, we need to calculate the Terminal Value, which accounts for all future cash flows beyond the first stage. For a number of reasons a very conservative growth rate is used that cannot exceed that of a country's GDP growth. In this case we have used the 5-year average of the 10-year government bond yield (1.8%) to estimate future growth. In the same way as with the 10-year 'growth' period, we discount future cash flows to today's value, using a cost of equity of 10%.
Terminal Value (TV)= FCF2033 × (1 + g) ÷ (r – g) = ₪133m× (1 + 1.8%) ÷ (10%– 1.8%) = ₪1.6b
Present Value of Terminal Value (PVTV)= TV / (1 + r)10= ₪1.6b÷ ( 1 + 10%)10= ₪592m
The total value is the sum of cash flows for the next ten years plus the discounted terminal value, which results in the Total Equity Value, which in this case is ₪1.3b. The last step is to then divide the equity value by the number of shares outstanding. Relative to the current share price of ₪119, the company appears around fair value at the time of writing. The assumptions in any calculation have a big impact on the valuation, so it is better to view this as a rough estimate, not precise down to the last cent.
Important Assumptions
The calculation above is very dependent on two assumptions. The first is the discount rate and the other is the cash flows. You don't have to agree with these inputs, I recommend redoing the calculations yourself and playing with them. The DCF also does not consider the possible cyclicality of an industry, or a company's future capital requirements, so it does not give a full picture of a company's potential performance. Given that we are looking at Scope Metals Group as potential shareholders, the cost of equity is used as the discount rate, rather than the cost of capital (or weighted average cost of capital, WACC) which accounts for debt. In this calculation we've used 10%, which is based on a levered beta of 1.407. Beta is a measure of a stock's volatility, compared to the market as a whole. We get our beta from the industry average beta of globally comparable companies, with an imposed limit between 0.8 and 2.0, which is a reasonable range for a stable business.
SWOT Analysis for Scope Metals Group
Strength
- Debt is well covered by earnings.
- Dividend is in the top 25% of dividend payers in the market.
Weakness
- Earnings declined over the past year.
- Current share price is above our estimate of fair value.
- Shareholders have been diluted in the past year.
Opportunity
- SCOP's financial characteristics indicate limited near-term opportunities for shareholders.
- Lack of analyst coverage makes it difficult to determine SCOP's earnings prospects.
Threat
- Debt is not well covered by operating cash flow.
- Dividends are not covered by cash flow.
Next Steps:
Valuation is only one side of the coin in terms of building your investment thesis, and it shouldn't be the only metric you look at when researching a company. The DCF model is not a perfect stock valuation tool. Rather it should be seen as a guide to "what assumptions need to be true for this stock to be under/overvalued?" If a company grows at a different rate, or if its cost of equity or risk free rate changes sharply, the output can look very different. For Scope Metals Group, we've compiled three additional elements you should assess:
- Risks: For example, we've discovered 4 warning signs for Scope Metals Group (1 is potentially serious!) that you should be aware of before investing here.
- Other High Quality Alternatives: Do you like a good all-rounder? Explore our interactive list of high quality stocks to get an idea of what else is out there you may be missing!
- Other Top Analyst Picks: Interested to see what the analysts are thinking? Take a look at our interactive list of analysts' top stock picks to find out what they feel might have an attractive future outlook!
PS. Simply Wall St updates its DCF calculation for every Israeli stock every day, so if you want to find the intrinsic value of any other stock just search here.
New: Manage All Your Stock Portfolios in One Place
We've created the ultimate portfolio companion for stock investors, and it's free.
• Connect an unlimited number of Portfolios and see your total in one currency
• Be alerted to new Warning Signs or Risks via email or mobile
• Track the Fair Value of your stocks
Have feedback on this article? Concerned about the content? Get in touch with us directly. Alternatively, email editorial-team (at) simplywallst.com.
This article by Simply Wall St is general in nature. We provide commentary based on historical data and analyst forecasts only using an unbiased methodology and our articles are not intended to be financial advice. It does not constitute a recommendation to buy or sell any stock, and does not take account of your objectives, or your financial situation. We aim to bring you long-term focused analysis driven by fundamental data. Note that our analysis may not factor in the latest price-sensitive company announcements or qualitative material. Simply Wall St has no position in any stocks mentioned.
About TASE:SCOP
Scope Metals Group
Scope Metals Group Ltd. stores, processes, and delivers metal and plastic worldwide.
Excellent balance sheet with questionable track record.
Market Insights

Advertisement
Community Narratives
MicroVision will explode future revenue by 380.37% with a vision towards success
Fair Value US$60.00|98.4% undervalued
TH
Community Contributor
The Indispensable Artery for a New North American Economy
Fair Value CA$132.87|1.3% undervalued
TI
Community Contributor