
Advertisement
It's Down 29% But Massivit 3D Printing Technologies Ltd (TLV:MSVT) Could Be Riskier Than It Looks
To the annoyance of some shareholders, Massivit 3D Printing Technologies Ltd (TLV:MSVT) shares are down a considerable 29% in the last month, which continues a horrid run for the company. The recent drop completes a disastrous twelve months for shareholders, who are sitting on a 75% loss during that time.
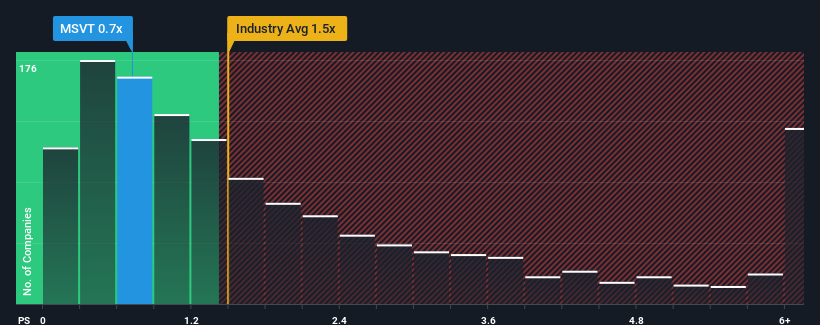
In spite of the heavy fall in price, it's still not a stretch to say that Massivit 3D Printing Technologies' price-to-sales (or "P/S") ratio of 0.7x right now seems quite "middle-of-the-road" compared to the Machinery industry in Israel, where the median P/S ratio is around 0.8x. While this might not raise any eyebrows, if the P/S ratio is not justified investors could be missing out on a potential opportunity or ignoring looming disappointment.
See our latest analysis for Massivit 3D Printing Technologies
What Does Massivit 3D Printing Technologies' Recent Performance Look Like?
Massivit 3D Printing Technologies has been doing a good job lately as it's been growing revenue at a solid pace. One possibility is that the P/S is moderate because investors think this respectable revenue growth might not be enough to outperform the broader industry in the near future. Those who are bullish on Massivit 3D Printing Technologies will be hoping that this isn't the case, so that they can pick up the stock at a lower valuation.
Want the full picture on earnings, revenue and cash flow for the company? Then our free report on Massivit 3D Printing Technologies will help you shine a light on its historical performance.What Are Revenue Growth Metrics Telling Us About The P/S?
Massivit 3D Printing Technologies' P/S ratio would be typical for a company that's only expected to deliver moderate growth, and importantly, perform in line with the industry.
Retrospectively, the last year delivered an exceptional 23% gain to the company's top line. Pleasingly, revenue has also lifted 265% in aggregate from three years ago, thanks to the last 12 months of growth. Accordingly, shareholders would have definitely welcomed those medium-term rates of revenue growth.
Comparing that to the industry, which is only predicted to deliver 16% growth in the next 12 months, the company's momentum is stronger based on recent medium-term annualised revenue results.
In light of this, it's curious that Massivit 3D Printing Technologies' P/S sits in line with the majority of other companies. Apparently some shareholders believe the recent performance is at its limits and have been accepting lower selling prices.
The Key Takeaway
Following Massivit 3D Printing Technologies' share price tumble, its P/S is just clinging on to the industry median P/S. Generally, our preference is to limit the use of the price-to-sales ratio to establishing what the market thinks about the overall health of a company.
We've established that Massivit 3D Printing Technologies currently trades on a lower than expected P/S since its recent three-year growth is higher than the wider industry forecast. It'd be fair to assume that potential risks the company faces could be the contributing factor to the lower than expected P/S. It appears some are indeed anticipating revenue instability, because the persistence of these recent medium-term conditions would normally provide a boost to the share price.
It is also worth noting that we have found 4 warning signs for Massivit 3D Printing Technologies (2 make us uncomfortable!) that you need to take into consideration.
It's important to make sure you look for a great company, not just the first idea you come across. So if growing profitability aligns with your idea of a great company, take a peek at this free list of interesting companies with strong recent earnings growth (and a low P/E).
New: Manage All Your Stock Portfolios in One Place
We've created the ultimate portfolio companion for stock investors, and it's free.
• Connect an unlimited number of Portfolios and see your total in one currency
• Be alerted to new Warning Signs or Risks via email or mobile
• Track the Fair Value of your stocks
Have feedback on this article? Concerned about the content? Get in touch with us directly. Alternatively, email editorial-team (at) simplywallst.com.
This article by Simply Wall St is general in nature. We provide commentary based on historical data and analyst forecasts only using an unbiased methodology and our articles are not intended to be financial advice. It does not constitute a recommendation to buy or sell any stock, and does not take account of your objectives, or your financial situation. We aim to bring you long-term focused analysis driven by fundamental data. Note that our analysis may not factor in the latest price-sensitive company announcements or qualitative material. Simply Wall St has no position in any stocks mentioned.
Have feedback on this article? Concerned about the content? Get in touch with us directly. Alternatively, email editorial-team@simplywallst.com
About TASE:MSVT
Massivit 3D Printing Technologies
Operates as a provider of industrial 3D printing systems in Italy and internationally.
Excellent balance sheet with moderate risk.
Market Insights

Advertisement
Community Narratives
MicroVision will explode future revenue by 380.37% with a vision towards success
Fair Value US$60.00|98.4% undervalued
TH
Community Contributor
The Indispensable Artery for a New North American Economy
Fair Value CA$132.87|1.3% undervalued
TI
Community Contributor