Stock Analysis
- Israel
- /
- Construction
- /
- TASE:BRAN
Baran Group Ltd's (TLV:BRAN) Stock Is Going Strong: Is the Market Following Fundamentals?

Baran Group (TLV:BRAN) has had a great run on the share market with its stock up by a significant 27% over the last three months. Since the market usually pay for a company’s long-term fundamentals, we decided to study the company’s key performance indicators to see if they could be influencing the market. Specifically, we decided to study Baran Group's ROE in this article.
Return on Equity or ROE is a test of how effectively a company is growing its value and managing investors’ money. In other words, it is a profitability ratio which measures the rate of return on the capital provided by the company's shareholders.
Check out our latest analysis for Baran Group
How Is ROE Calculated?
The formula for ROE is:
Return on Equity = Net Profit (from continuing operations) ÷ Shareholders' Equity
So, based on the above formula, the ROE for Baran Group is:
14% = ₪31m ÷ ₪218m (Based on the trailing twelve months to September 2023).
The 'return' refers to a company's earnings over the last year. Another way to think of that is that for every ₪1 worth of equity, the company was able to earn ₪0.14 in profit.
Why Is ROE Important For Earnings Growth?
We have already established that ROE serves as an efficient profit-generating gauge for a company's future earnings. Based on how much of its profits the company chooses to reinvest or "retain", we are then able to evaluate a company's future ability to generate profits. Assuming everything else remains unchanged, the higher the ROE and profit retention, the higher the growth rate of a company compared to companies that don't necessarily bear these characteristics.
Baran Group's Earnings Growth And 14% ROE
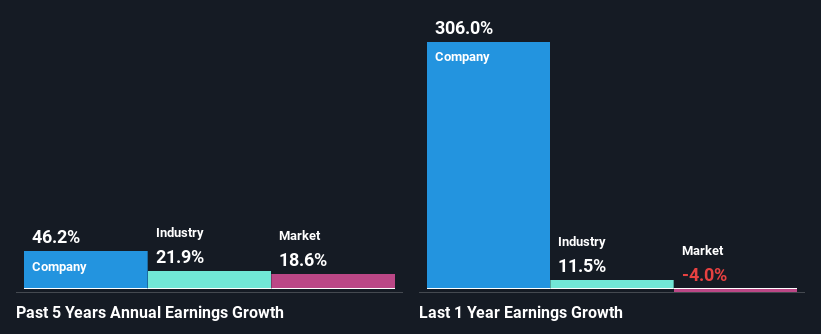
To begin with, Baran Group seems to have a respectable ROE. Further, the company's ROE compares quite favorably to the industry average of 11%. This probably laid the ground for Baran Group's significant 46% net income growth seen over the past five years. However, there could also be other causes behind this growth. For instance, the company has a low payout ratio or is being managed efficiently.
Next, on comparing with the industry net income growth, we found that Baran Group's growth is quite high when compared to the industry average growth of 22% in the same period, which is great to see.
The basis for attaching value to a company is, to a great extent, tied to its earnings growth. The investor should try to establish if the expected growth or decline in earnings, whichever the case may be, is priced in. This then helps them determine if the stock is placed for a bright or bleak future. Is Baran Group fairly valued compared to other companies? These 3 valuation measures might help you decide.
Is Baran Group Using Its Retained Earnings Effectively?
Given that Baran Group doesn't pay any dividend to its shareholders, we infer that the company has been reinvesting all of its profits to grow its business.
Summary
In total, we are pretty happy with Baran Group's performance. Specifically, we like that the company is reinvesting a huge chunk of its profits at a high rate of return. This of course has caused the company to see substantial growth in its earnings. If the company continues to grow its earnings the way it has, that could have a positive impact on its share price given how earnings per share influence long-term share prices. Let's not forget, business risk is also one of the factors that affects the price of the stock. So this is also an important area that investors need to pay attention to before making a decision on any business. Our risks dashboard would have the 3 risks we have identified for Baran Group.
Valuation is complex, but we're helping make it simple.
Find out whether Baran Group is potentially over or undervalued by checking out our comprehensive analysis, which includes fair value estimates, risks and warnings, dividends, insider transactions and financial health.
View the Free AnalysisHave feedback on this article? Concerned about the content? Get in touch with us directly. Alternatively, email editorial-team (at) simplywallst.com.
This article by Simply Wall St is general in nature. We provide commentary based on historical data and analyst forecasts only using an unbiased methodology and our articles are not intended to be financial advice. It does not constitute a recommendation to buy or sell any stock, and does not take account of your objectives, or your financial situation. We aim to bring you long-term focused analysis driven by fundamental data. Note that our analysis may not factor in the latest price-sensitive company announcements or qualitative material. Simply Wall St has no position in any stocks mentioned.
About TASE:BRAN
Baran Group
Baran Group Ltd provides engineering, technology, telecommunication, and construction solutions worldwide.
Solid track record with excellent balance sheet.

