- Israel
- /
- Construction
- /
- TASE:ASHG
Ashtrom Group (TLV:ASHG shareholders incur further losses as stock declines 4.5% this week, taking three-year losses to 27%


In order to justify the effort of selecting individual stocks, it's worth striving to beat the returns from a market index fund. But the risk of stock picking is that you will likely buy under-performing companies. Unfortunately, that's been the case for longer term Ashtrom Group Ltd. (TLV:ASHG) shareholders, since the share price is down 33% in the last three years, falling well short of the market decline of around 1.2%. More recently, the share price has dropped a further 12% in a month.
After losing 4.5% this past week, it's worth investigating the company's fundamentals to see what we can infer from past performance.
View our latest analysis for Ashtrom Group
To paraphrase Benjamin Graham: Over the short term the market is a voting machine, but over the long term it's a weighing machine. One flawed but reasonable way to assess how sentiment around a company has changed is to compare the earnings per share (EPS) with the share price.
Over the three years that the share price declined, Ashtrom Group's earnings per share (EPS) dropped significantly, falling to a loss. This was, in part, due to extraordinary items impacting earnings. Since the company has fallen to a loss making position, it's hard to compare the change in EPS with the share price change. But it's safe to say we'd generally expect the share price to be lower as a result!
The graphic below depicts how EPS has changed over time (unveil the exact values by clicking on the image).
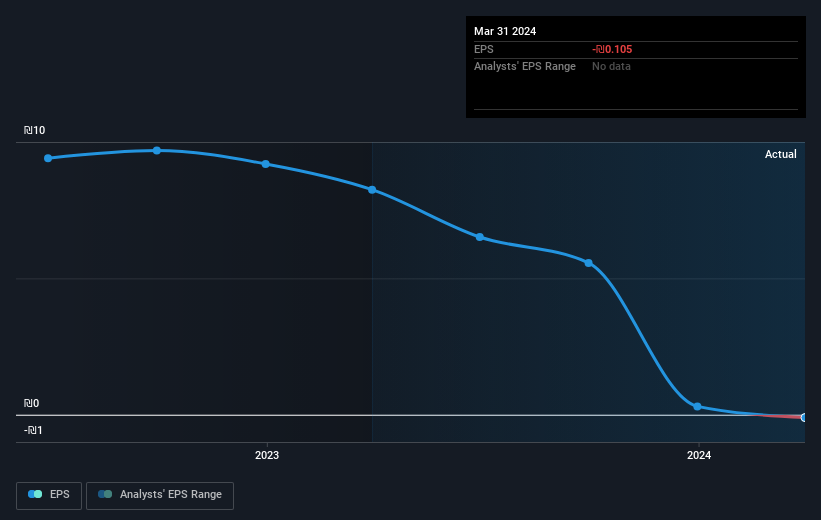
Dive deeper into Ashtrom Group's key metrics by checking this interactive graph of Ashtrom Group's earnings, revenue and cash flow.
What About The Total Shareholder Return (TSR)?
Investors should note that there's a difference between Ashtrom Group's total shareholder return (TSR) and its share price change, which we've covered above. Arguably the TSR is a more complete return calculation because it accounts for the value of dividends (as if they were reinvested), along with the hypothetical value of any discounted capital that have been offered to shareholders. Ashtrom Group's TSR of was a loss of 27% for the 3 years. That wasn't as bad as its share price return, because it has paid dividends.
A Different Perspective
Investors in Ashtrom Group had a tough year, with a total loss of 15%, against a market gain of about 3.5%. However, keep in mind that even the best stocks will sometimes underperform the market over a twelve month period. On the bright side, long term shareholders have made money, with a gain of 9% per year over half a decade. It could be that the recent sell-off is an opportunity, so it may be worth checking the fundamental data for signs of a long term growth trend. While it is well worth considering the different impacts that market conditions can have on the share price, there are other factors that are even more important. Consider for instance, the ever-present spectre of investment risk. We've identified 2 warning signs with Ashtrom Group (at least 1 which shouldn't be ignored) , and understanding them should be part of your investment process.
For those who like to find winning investments this free list of undervalued companies with recent insider purchasing, could be just the ticket.
Please note, the market returns quoted in this article reflect the market weighted average returns of stocks that currently trade on Israeli exchanges.
New: Manage All Your Stock Portfolios in One Place
We've created the ultimate portfolio companion for stock investors, and it's free.
• Connect an unlimited number of Portfolios and see your total in one currency
• Be alerted to new Warning Signs or Risks via email or mobile
• Track the Fair Value of your stocks
Have feedback on this article? Concerned about the content? Get in touch with us directly. Alternatively, email editorial-team (at) simplywallst.com.
This article by Simply Wall St is general in nature. We provide commentary based on historical data and analyst forecasts only using an unbiased methodology and our articles are not intended to be financial advice. It does not constitute a recommendation to buy or sell any stock, and does not take account of your objectives, or your financial situation. We aim to bring you long-term focused analysis driven by fundamental data. Note that our analysis may not factor in the latest price-sensitive company announcements or qualitative material. Simply Wall St has no position in any stocks mentioned.
About TASE:ASHG
Ashtrom Group
Operates as a construction and property company in Israel and internationally.
Fair value very low.
