Stock Analysis
Declining Stock and Solid Fundamentals: Is The Market Wrong About Span d.d. (ZGSE:SPAN)?


Span d.d (ZGSE:SPAN) has had a rough three months with its share price down 15%. However, a closer look at its sound financials might cause you to think again. Given that fundamentals usually drive long-term market outcomes, the company is worth looking at. Particularly, we will be paying attention to Span d.d's ROE today.
Return on equity or ROE is a key measure used to assess how efficiently a company's management is utilizing the company's capital. In short, ROE shows the profit each dollar generates with respect to its shareholder investments.
See our latest analysis for Span d.d
How Is ROE Calculated?
ROE can be calculated by using the formula:
Return on Equity = Net Profit (from continuing operations) ÷ Shareholders' Equity
So, based on the above formula, the ROE for Span d.d is:
13% = €4.1m ÷ €31m (Based on the trailing twelve months to September 2023).
The 'return' refers to a company's earnings over the last year. That means that for every €1 worth of shareholders' equity, the company generated €0.13 in profit.
Why Is ROE Important For Earnings Growth?
We have already established that ROE serves as an efficient profit-generating gauge for a company's future earnings. We now need to evaluate how much profit the company reinvests or "retains" for future growth which then gives us an idea about the growth potential of the company. Assuming all else is equal, companies that have both a higher return on equity and higher profit retention are usually the ones that have a higher growth rate when compared to companies that don't have the same features.
Span d.d's Earnings Growth And 13% ROE
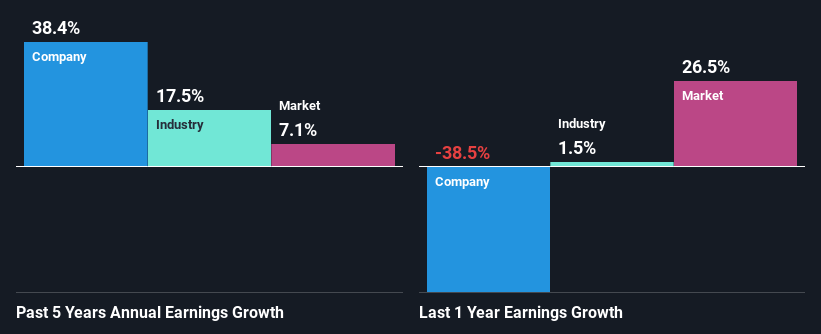
At first glance, Span d.d seems to have a decent ROE. Even when compared to the industry average of 15% the company's ROE looks quite decent. This probably goes some way in explaining Span d.d's significant 38% net income growth over the past five years amongst other factors. However, there could also be other drivers behind this growth. Such as - high earnings retention or an efficient management in place.
Next, on comparing with the industry net income growth, we found that Span d.d's growth is quite high when compared to the industry average growth of 18% in the same period, which is great to see.
The basis for attaching value to a company is, to a great extent, tied to its earnings growth. What investors need to determine next is if the expected earnings growth, or the lack of it, is already built into the share price. By doing so, they will have an idea if the stock is headed into clear blue waters or if swampy waters await. If you're wondering about Span d.d's's valuation, check out this gauge of its price-to-earnings ratio, as compared to its industry.
Is Span d.d Using Its Retained Earnings Effectively?
Span d.d's three-year median payout ratio is a pretty moderate 41%, meaning the company retains 59% of its income. This suggests that its dividend is well covered, and given the high growth we discussed above, it looks like Span d.d is reinvesting its earnings efficiently.
While Span d.d has been growing its earnings, it only recently started to pay dividends which likely means that the company decided to impress new and existing shareholders with a dividend.
Summary
In total, we are pretty happy with Span d.d's performance. Specifically, we like that the company is reinvesting a huge chunk of its profits at a high rate of return. This of course has caused the company to see substantial growth in its earnings. If the company continues to grow its earnings the way it has, that could have a positive impact on its share price given how earnings per share influence long-term share prices. Not to forget, share price outcomes are also dependent on the potential risks a company may face. So it is important for investors to be aware of the risks involved in the business. To know the 4 risks we have identified for Span d.d visit our risks dashboard for free.
Valuation is complex, but we're helping make it simple.
Find out whether Span d.d is potentially over or undervalued by checking out our comprehensive analysis, which includes fair value estimates, risks and warnings, dividends, insider transactions and financial health.
View the Free AnalysisHave feedback on this article? Concerned about the content? Get in touch with us directly. Alternatively, email editorial-team (at) simplywallst.com.
This article by Simply Wall St is general in nature. We provide commentary based on historical data and analyst forecasts only using an unbiased methodology and our articles are not intended to be financial advice. It does not constitute a recommendation to buy or sell any stock, and does not take account of your objectives, or your financial situation. We aim to bring you long-term focused analysis driven by fundamental data. Note that our analysis may not factor in the latest price-sensitive company announcements or qualitative material. Simply Wall St has no position in any stocks mentioned.
About ZGSE:SPAN
Span d.d
Provides information technology (IT) solutions to companies in Croatia, Slovenia, the United States, the United Kingdom, Ukraine, and internationally.
Flawless balance sheet second-rate dividend payer.
