Stock Analysis
- Hong Kong
- /
- Infrastructure
- /
- SEHK:357
Return Trends At Hainan Meilan International Airport (HKG:357) Aren't Appealing


If we want to find a stock that could multiply over the long term, what are the underlying trends we should look for? In a perfect world, we'd like to see a company investing more capital into its business and ideally the returns earned from that capital are also increasing. Ultimately, this demonstrates that it's a business that is reinvesting profits at increasing rates of return. Although, when we looked at Hainan Meilan International Airport (HKG:357), it didn't seem to tick all of these boxes.
What is Return On Capital Employed (ROCE)?
For those who don't know, ROCE is a measure of a company's yearly pre-tax profit (its return), relative to the capital employed in the business. The formula for this calculation on Hainan Meilan International Airport is:
Return on Capital Employed = Earnings Before Interest and Tax (EBIT) ÷ (Total Assets - Current Liabilities)
0.12 = CN¥527m ÷ (CN¥11b - CN¥6.9b) (Based on the trailing twelve months to June 2021).
Therefore, Hainan Meilan International Airport has an ROCE of 12%. On its own, that's a standard return, however it's much better than the 8.2% generated by the Infrastructure industry.
Check out our latest analysis for Hainan Meilan International Airport
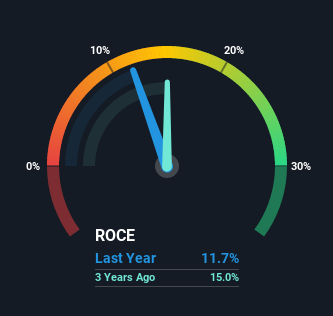
Above you can see how the current ROCE for Hainan Meilan International Airport compares to its prior returns on capital, but there's only so much you can tell from the past. If you'd like, you can check out the forecasts from the analysts covering Hainan Meilan International Airport here for free.
What Can We Tell From Hainan Meilan International Airport's ROCE Trend?
We're a bit concerned with the trends, because the business is applying 26% less capital than it was five years ago and returns on that capital have stayed flat. To us that doesn't look like a multi-bagger because the company appears to be selling assets and it's returns aren't increasing. You could assume that if this continues, the business will be smaller in a few year time, so probably not a multi-bagger.
Another point to note, we noticed the company has increased current liabilities over the last five years. This is intriguing because if current liabilities hadn't increased to 61% of total assets, this reported ROCE would probably be less than12% because total capital employed would be higher.The 12% ROCE could be even lower if current liabilities weren't 61% of total assets, because the the formula would show a larger base of total capital employed. So with current liabilities at such high levels, this effectively means the likes of suppliers or short-term creditors are funding a meaningful part of the business, which in some instances can bring some risks.
The Bottom Line On Hainan Meilan International Airport's ROCE
In summary, Hainan Meilan International Airport isn't reinvesting funds back into the business and returns aren't growing. Yet to long term shareholders the stock has gifted them an incredible 323% return in the last five years, so the market appears to be rosy about its future. But if the trajectory of these underlying trends continue, we think the likelihood of it being a multi-bagger from here isn't high.
Hainan Meilan International Airport does have some risks though, and we've spotted 2 warning signs for Hainan Meilan International Airport that you might be interested in.
While Hainan Meilan International Airport isn't earning the highest return, check out this free list of companies that are earning high returns on equity with solid balance sheets.
If you're looking for stocks to buy, use the lowest-cost* platform that is rated #1 Overall by Barron’s, Interactive Brokers. Trade stocks, options, futures, forex, bonds and funds on 135 markets, all from a single integrated account. Promoted
Valuation is complex, but we're helping make it simple.
Find out whether Hainan Meilan International Airport is potentially over or undervalued by checking out our comprehensive analysis, which includes fair value estimates, risks and warnings, dividends, insider transactions and financial health.
View the Free AnalysisThis article by Simply Wall St is general in nature. We provide commentary based on historical data and analyst forecasts only using an unbiased methodology and our articles are not intended to be financial advice. It does not constitute a recommendation to buy or sell any stock, and does not take account of your objectives, or your financial situation. We aim to bring you long-term focused analysis driven by fundamental data. Note that our analysis may not factor in the latest price-sensitive company announcements or qualitative material. Simply Wall St has no position in any stocks mentioned.
*Interactive Brokers Rated Lowest Cost Broker by StockBrokers.com Annual Online Review 2020
Have feedback on this article? Concerned about the content? Get in touch with us directly. Alternatively, email editorial-team (at) simplywallst.com.
About SEHK:357
Hainan Meilan International Airport
Engages in the aeronautical and non-aeronautical businesses at the Haikou Meilan Airport in Haikou, the People's Republic of China.
Reasonable growth potential with worrying balance sheet.
