Investors in Cathay Pacific Airways (HKG:293) have unfortunately lost 22% over the last five years

In order to justify the effort of selecting individual stocks, it's worth striving to beat the returns from a market index fund. But even the best stock picker will only win with some selections. So we wouldn't blame long term Cathay Pacific Airways Limited (HKG:293) shareholders for doubting their decision to hold, with the stock down 34% over a half decade.
So let's have a look and see if the longer term performance of the company has been in line with the underlying business' progress.
See our latest analysis for Cathay Pacific Airways
There is no denying that markets are sometimes efficient, but prices do not always reflect underlying business performance. By comparing earnings per share (EPS) and share price changes over time, we can get a feel for how investor attitudes to a company have morphed over time.
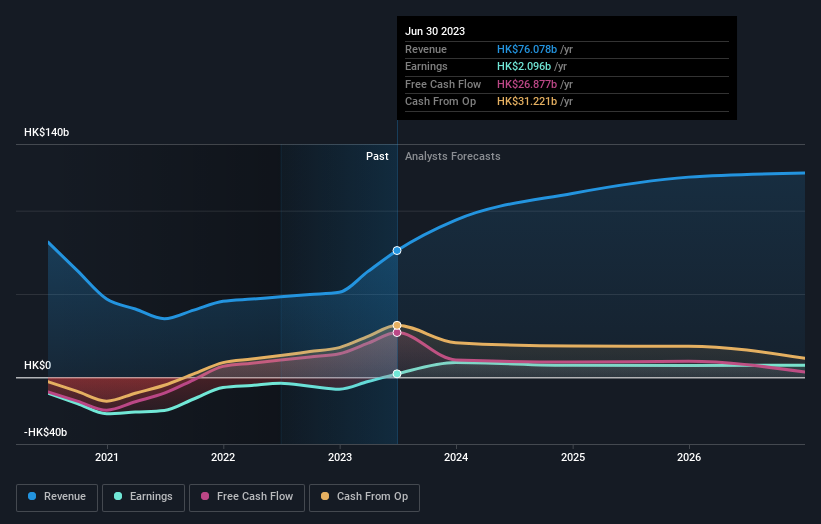
Cathay Pacific Airways became profitable within the last five years. Most would consider that to be a good thing, so it's counter-intuitive to see the share price declining. Other metrics may better explain the share price move.
Arguably, the revenue drop of 20% a year for half a decade suggests that the company can't grow in the long term. This has probably encouraged some shareholders to sell down the stock.
The company's revenue and earnings (over time) are depicted in the image below (click to see the exact numbers).
Cathay Pacific Airways is a well known stock, with plenty of analyst coverage, suggesting some visibility into future growth. You can see what analysts are predicting for Cathay Pacific Airways in this interactive graph of future profit estimates.
What About The Total Shareholder Return (TSR)?
Investors should note that there's a difference between Cathay Pacific Airways' total shareholder return (TSR) and its share price change, which we've covered above. The TSR is a return calculation that accounts for the value of cash dividends (assuming that any dividend received was reinvested) and the calculated value of any discounted capital raisings and spin-offs. Its history of dividend payouts mean that Cathay Pacific Airways' TSR, which was a 22% drop over the last 5 years, was not as bad as the share price return.
A Different Perspective
It's good to see that Cathay Pacific Airways has rewarded shareholders with a total shareholder return of 2.3% in the last twelve months. Notably the five-year annualised TSR loss of 4% per year compares very unfavourably with the recent share price performance. This makes us a little wary, but the business might have turned around its fortunes. It's always interesting to track share price performance over the longer term. But to understand Cathay Pacific Airways better, we need to consider many other factors. For example, we've discovered 1 warning sign for Cathay Pacific Airways that you should be aware of before investing here.
If you like to buy stocks alongside management, then you might just love this free list of companies. (Hint: insiders have been buying them).
Please note, the market returns quoted in this article reflect the market weighted average returns of stocks that currently trade on Hong Kong exchanges.
New: AI Stock Screener & Alerts
Our new AI Stock Screener scans the market every day to uncover opportunities.
• Dividend Powerhouses (3%+ Yield)
• Undervalued Small Caps with Insider Buying
• High growth Tech and AI Companies
Or build your own from over 50 metrics.
Have feedback on this article? Concerned about the content? Get in touch with us directly. Alternatively, email editorial-team (at) simplywallst.com.
This article by Simply Wall St is general in nature. We provide commentary based on historical data and analyst forecasts only using an unbiased methodology and our articles are not intended to be financial advice. It does not constitute a recommendation to buy or sell any stock, and does not take account of your objectives, or your financial situation. We aim to bring you long-term focused analysis driven by fundamental data. Note that our analysis may not factor in the latest price-sensitive company announcements or qualitative material. Simply Wall St has no position in any stocks mentioned.
About SEHK:293
Cathay Pacific Airways
Offers international passenger and air cargo transportation services.
Very undervalued with solid track record and pays a dividend.
