- Hong Kong
- /
- Marine and Shipping
- /
- SEHK:1308
SITC International Holdings' (HKG:1308) five-year earnings growth trails the fantastic shareholder returns


When you buy a stock there is always a possibility that it could drop 100%. But when you pick a company that is really flourishing, you can make more than 100%. One great example is SITC International Holdings Company Limited (HKG:1308) which saw its share price drive 166% higher over five years. It's also up 15% in about a month. But this could be related to good market conditions -- stocks in its market are up 9.3% in the last month.
On the back of a solid 7-day performance, let's check what role the company's fundamentals have played in driving long term shareholder returns.
See our latest analysis for SITC International Holdings
While the efficient markets hypothesis continues to be taught by some, it has been proven that markets are over-reactive dynamic systems, and investors are not always rational. One imperfect but simple way to consider how the market perception of a company has shifted is to compare the change in the earnings per share (EPS) with the share price movement.
Over half a decade, SITC International Holdings managed to grow its earnings per share at 21% a year. That makes the EPS growth particularly close to the yearly share price growth of 22%. That suggests that the market sentiment around the company hasn't changed much over that time. Indeed, it would appear the share price is reacting to the EPS.
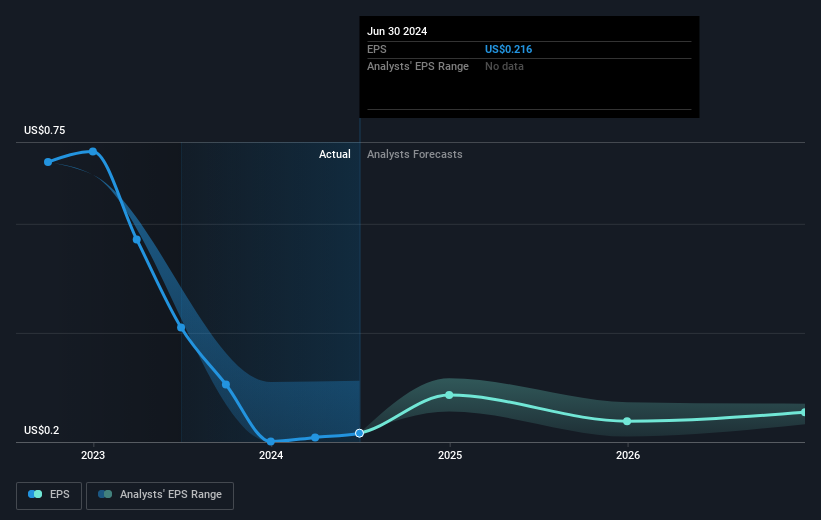
The image below shows how EPS has tracked over time (if you click on the image you can see greater detail).
Dive deeper into SITC International Holdings' key metrics by checking this interactive graph of SITC International Holdings's earnings, revenue and cash flow.
What About Dividends?
As well as measuring the share price return, investors should also consider the total shareholder return (TSR). Whereas the share price return only reflects the change in the share price, the TSR includes the value of dividends (assuming they were reinvested) and the benefit of any discounted capital raising or spin-off. It's fair to say that the TSR gives a more complete picture for stocks that pay a dividend. We note that for SITC International Holdings the TSR over the last 5 years was 357%, which is better than the share price return mentioned above. And there's no prize for guessing that the dividend payments largely explain the divergence!
A Different Perspective
We're pleased to report that SITC International Holdings shareholders have received a total shareholder return of 72% over one year. Of course, that includes the dividend. That's better than the annualised return of 36% over half a decade, implying that the company is doing better recently. Someone with an optimistic perspective could view the recent improvement in TSR as indicating that the business itself is getting better with time. It's always interesting to track share price performance over the longer term. But to understand SITC International Holdings better, we need to consider many other factors. For example, we've discovered 2 warning signs for SITC International Holdings that you should be aware of before investing here.
If you are like me, then you will not want to miss this free list of undervalued small caps that insiders are buying.
Please note, the market returns quoted in this article reflect the market weighted average returns of stocks that currently trade on Hong Kong exchanges.
New: Manage All Your Stock Portfolios in One Place
We've created the ultimate portfolio companion for stock investors, and it's free.
• Connect an unlimited number of Portfolios and see your total in one currency
• Be alerted to new Warning Signs or Risks via email or mobile
• Track the Fair Value of your stocks
Have feedback on this article? Concerned about the content? Get in touch with us directly. Alternatively, email editorial-team (at) simplywallst.com.
This article by Simply Wall St is general in nature. We provide commentary based on historical data and analyst forecasts only using an unbiased methodology and our articles are not intended to be financial advice. It does not constitute a recommendation to buy or sell any stock, and does not take account of your objectives, or your financial situation. We aim to bring you long-term focused analysis driven by fundamental data. Note that our analysis may not factor in the latest price-sensitive company announcements or qualitative material. Simply Wall St has no position in any stocks mentioned.
About SEHK:1308
SITC International Holdings
A shipping logistics company, engages in the provision of integrated transportation and logistics solutions in Mainland China, Hong Kong, Taiwan, Japan, Southeast Asia, and internationally.
Flawless balance sheet average dividend payer.
