
Advertisement
- Hong Kong
- /
- Electronic Equipment and Components
- /
- SEHK:3302
Is Kinergy (HKG:3302) Using Debt In A Risky Way?
David Iben put it well when he said, 'Volatility is not a risk we care about. What we care about is avoiding the permanent loss of capital.' When we think about how risky a company is, we always like to look at its use of debt, since debt overload can lead to ruin. Importantly, Kinergy Corporation Ltd. (HKG:3302) does carry debt. But the real question is whether this debt is making the company risky.
What Risk Does Debt Bring?
Debt and other liabilities become risky for a business when it cannot easily fulfill those obligations, either with free cash flow or by raising capital at an attractive price. Part and parcel of capitalism is the process of 'creative destruction' where failed businesses are mercilessly liquidated by their bankers. However, a more common (but still painful) scenario is that it has to raise new equity capital at a low price, thus permanently diluting shareholders. Having said that, the most common situation is where a company manages its debt reasonably well - and to its own advantage. When we think about a company's use of debt, we first look at cash and debt together.
Check out our latest analysis for Kinergy
What Is Kinergy's Debt?
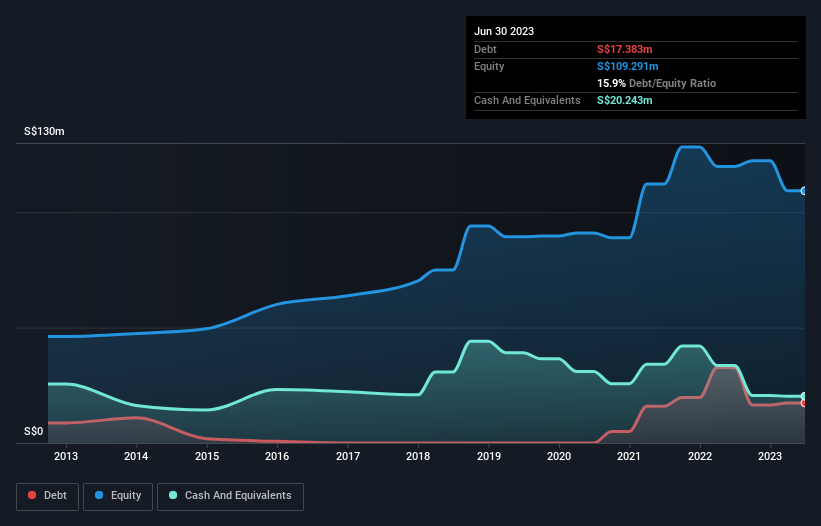
The image below, which you can click on for greater detail, shows that Kinergy had debt of S$17.4m at the end of June 2023, a reduction from S$32.8m over a year. However, it does have S$20.2m in cash offsetting this, leading to net cash of S$2.86m.
How Healthy Is Kinergy's Balance Sheet?
According to the last reported balance sheet, Kinergy had liabilities of S$32.5m due within 12 months, and liabilities of S$9.41m due beyond 12 months. Offsetting these obligations, it had cash of S$20.2m as well as receivables valued at S$18.0m due within 12 months. So its liabilities total S$3.62m more than the combination of its cash and short-term receivables.
Since publicly traded Kinergy shares are worth a total of S$45.1m, it seems unlikely that this level of liabilities would be a major threat. But there are sufficient liabilities that we would certainly recommend shareholders continue to monitor the balance sheet, going forward. While it does have liabilities worth noting, Kinergy also has more cash than debt, so we're pretty confident it can manage its debt safely. There's no doubt that we learn most about debt from the balance sheet. But you can't view debt in total isolation; since Kinergy will need earnings to service that debt. So if you're keen to discover more about its earnings, it might be worth checking out this graph of its long term earnings trend.
Over 12 months, Kinergy made a loss at the EBIT level, and saw its revenue drop to S$97m, which is a fall of 40%. To be frank that doesn't bode well.
So How Risky Is Kinergy?
While Kinergy lost money on an earnings before interest and tax (EBIT) level, it actually booked a paper profit of S$177k. So when you consider it has net cash, along with the statutory profit, the stock probably isn't as risky as it might seem, at least in the short term. With revenue growth uninspiring, we'd really need to see some positive EBIT before mustering much enthusiasm for this business. There's no doubt that we learn most about debt from the balance sheet. But ultimately, every company can contain risks that exist outside of the balance sheet. To that end, you should be aware of the 5 warning signs we've spotted with Kinergy .
If, after all that, you're more interested in a fast growing company with a rock-solid balance sheet, then check out our list of net cash growth stocks without delay.
Valuation is complex, but we're here to simplify it.
Discover if Kinergy might be undervalued or overvalued with our detailed analysis, featuring fair value estimates, potential risks, dividends, insider trades, and its financial condition.
Access Free AnalysisHave feedback on this article? Concerned about the content? Get in touch with us directly. Alternatively, email editorial-team (at) simplywallst.com.
This article by Simply Wall St is general in nature. We provide commentary based on historical data and analyst forecasts only using an unbiased methodology and our articles are not intended to be financial advice. It does not constitute a recommendation to buy or sell any stock, and does not take account of your objectives, or your financial situation. We aim to bring you long-term focused analysis driven by fundamental data. Note that our analysis may not factor in the latest price-sensitive company announcements or qualitative material. Simply Wall St has no position in any stocks mentioned.
About SEHK:3302
Kinergy
Provides contract manufacturing, design, engineering, and assembly services for the electronics industry in Singapore, the Philippines, the United States, the Mainland China, Japan, and internationally.
Slight risk with mediocre balance sheet.
Market Insights

Advertisement
Community Narratives
MicroVision will explode future revenue by 380.37% with a vision towards success
Fair Value US$60|98.4% undervalued
TH
Community Contributor
The Indispensable Artery for a New North American Economy
Fair Value CA$132.87|1.6% undervalued
TI
Community Contributor
Recently Updated Narratives
BE


Bejgal on MINISO Group Holding ·
MINISO's fair value is projected at 26.69 with an anticipated PE ratio shift of 20x
Fair Value:US$26.6928.0% undervalued
44 followersusers have followed this narrative
3 commentsusers have commented on this narrative
0 likesusers have liked this narrative
TI


TickerTickle on Oracle ·
The Quiet Giant That Became AI’s Power Grid
Fair Value:US$389.8149.5% undervalued
7 followersusers have followed this narrative
1 commentusers have commented on this narrative
0 likesusers have liked this narrative
AU

AuCA on Nova Ljubljanska Banka d.d ·
Nova Ljubljanska Banka d.d will expect a 11.2% revenue boost driving future growth
Fair Value:€20916.3% undervalued
23 followersusers have followed this narrative
3 commentsusers have commented on this narrative
0 likesusers have liked this narrative
Popular Narratives
OS


oscargarcia on Alphabet ·
The company that turned a verb into a global necessity and basically runs the modern internet, digital ads, smartphones, maps, and AI.
Fair Value:US$3404.9% undervalued
134 followersusers have followed this narrative
6 commentsusers have commented on this narrative
18 likesusers have liked this narrative
TH

TheWallstreetKing on MicroVision ·
MicroVision will explode future revenue by 380.37% with a vision towards success
Fair Value:US$6098.4% undervalued
83 followersusers have followed this narrative
11 commentsusers have commented on this narrative
18 likesusers have liked this narrative
AN


AnalystConsensusTarget on NVIDIA ·
NVDA: Expanding AI Demand Will Drive Major Data Center Investments Through 2026
Fair Value:US$232.7923.6% undervalued
923 followersusers have followed this narrative
5 commentsusers have commented on this narrative
22 likesusers have liked this narrative