
Advertisement
- Hong Kong
- /
- Electronic Equipment and Components
- /
- SEHK:2350
Subdued Growth No Barrier To MTT Group Holdings Limited (HKG:2350) With Shares Advancing 29%
Despite an already strong run, MTT Group Holdings Limited (HKG:2350) shares have been powering on, with a gain of 29% in the last thirty days. The last 30 days bring the annual gain to a very sharp 68%.
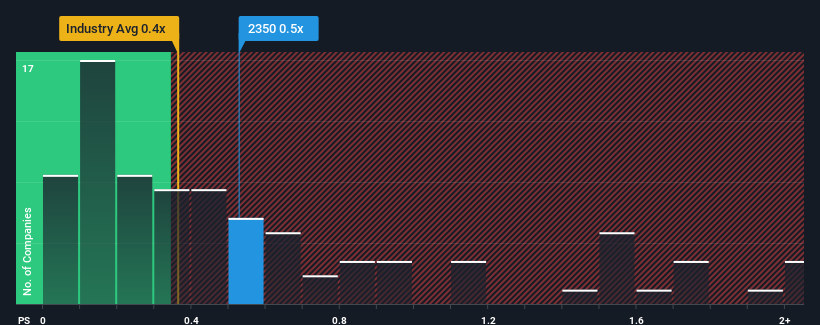
Although its price has surged higher, you could still be forgiven for feeling indifferent about MTT Group Holdings' P/S ratio of 0.5x, since the median price-to-sales (or "P/S") ratio for the Electronic industry in Hong Kong is also close to 0.4x. Although, it's not wise to simply ignore the P/S without explanation as investors may be disregarding a distinct opportunity or a costly mistake.
See our latest analysis for MTT Group Holdings
How Has MTT Group Holdings Performed Recently?
For example, consider that MTT Group Holdings' financial performance has been poor lately as its revenue has been in decline. It might be that many expect the company to put the disappointing revenue performance behind them over the coming period, which has kept the P/S from falling. If not, then existing shareholders may be a little nervous about the viability of the share price.
Want the full picture on earnings, revenue and cash flow for the company? Then our free report on MTT Group Holdings will help you shine a light on its historical performance.Is There Some Revenue Growth Forecasted For MTT Group Holdings?
MTT Group Holdings' P/S ratio would be typical for a company that's only expected to deliver moderate growth, and importantly, perform in line with the industry.
Retrospectively, the last year delivered a frustrating 17% decrease to the company's top line. Even so, admirably revenue has lifted 62% in aggregate from three years ago, notwithstanding the last 12 months. So we can start by confirming that the company has generally done a very good job of growing revenue over that time, even though it had some hiccups along the way.
Comparing that to the industry, which is predicted to deliver 20% growth in the next 12 months, the company's momentum is weaker, based on recent medium-term annualised revenue results.
With this information, we find it interesting that MTT Group Holdings is trading at a fairly similar P/S compared to the industry. Apparently many investors in the company are less bearish than recent times would indicate and aren't willing to let go of their stock right now. They may be setting themselves up for future disappointment if the P/S falls to levels more in line with recent growth rates.
What Does MTT Group Holdings' P/S Mean For Investors?
Its shares have lifted substantially and now MTT Group Holdings' P/S is back within range of the industry median. It's argued the price-to-sales ratio is an inferior measure of value within certain industries, but it can be a powerful business sentiment indicator.
We've established that MTT Group Holdings' average P/S is a bit surprising since its recent three-year growth is lower than the wider industry forecast. Right now we are uncomfortable with the P/S as this revenue performance isn't likely to support a more positive sentiment for long. If recent medium-term revenue trends continue, the probability of a share price decline will become quite substantial, placing shareholders at risk.
It is also worth noting that we have found 3 warning signs for MTT Group Holdings (2 are a bit concerning!) that you need to take into consideration.
It's important to make sure you look for a great company, not just the first idea you come across. So if growing profitability aligns with your idea of a great company, take a peek at this free list of interesting companies with strong recent earnings growth (and a low P/E).
New: Manage All Your Stock Portfolios in One Place
We've created the ultimate portfolio companion for stock investors, and it's free.
• Connect an unlimited number of Portfolios and see your total in one currency
• Be alerted to new Warning Signs or Risks via email or mobile
• Track the Fair Value of your stocks
Have feedback on this article? Concerned about the content? Get in touch with us directly. Alternatively, email editorial-team (at) simplywallst.com.
This article by Simply Wall St is general in nature. We provide commentary based on historical data and analyst forecasts only using an unbiased methodology and our articles are not intended to be financial advice. It does not constitute a recommendation to buy or sell any stock, and does not take account of your objectives, or your financial situation. We aim to bring you long-term focused analysis driven by fundamental data. Note that our analysis may not factor in the latest price-sensitive company announcements or qualitative material. Simply Wall St has no position in any stocks mentioned.
Have feedback on this article? Concerned about the content? Get in touch with us directly. Alternatively, email editorial-team@simplywallst.com
About SEHK:2350
MTT Group Holdings
An investment holding company, engages in the distribution of IT products in Hong Kong, the People's Republic of China, and Malaysia.
Excellent balance sheet and good value.
Similar Companies
Market Insights

Advertisement
Community Narratives
MicroVision will explode future revenue by 380.37% with a vision towards success
Fair Value US$60.00|98.4% undervalued
TH
Community Contributor
The Indispensable Artery for a New North American Economy
Fair Value CA$132.87|1.3% undervalued
TI
Community Contributor