
Advertisement
- Hong Kong
- /
- Electronic Equipment and Components
- /
- SEHK:2078
PanAsialum Holdings Company Limited's (HKG:2078) Popularity With Investors Under Threat As Stock Sinks 58%
PanAsialum Holdings Company Limited (HKG:2078) shares have had a horrible month, losing 58% after a relatively good period beforehand. The drop over the last 30 days has capped off a tough year for shareholders, with the share price down 24% in that time.
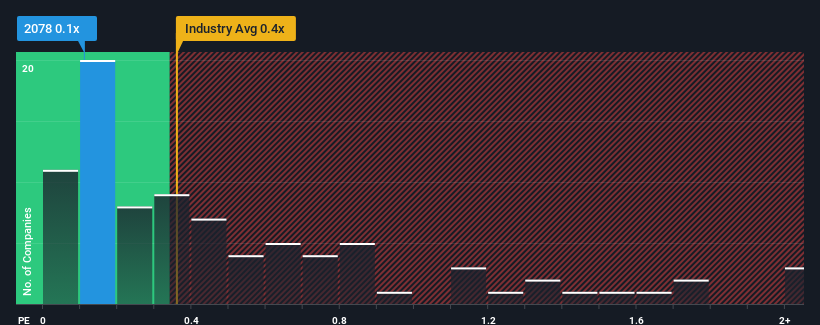
Although its price has dipped substantially, it's still not a stretch to say that PanAsialum Holdings' price-to-sales (or "P/S") ratio of 0.1x right now seems quite "middle-of-the-road" compared to the Electronic industry in Hong Kong, where the median P/S ratio is around 0.4x. Although, it's not wise to simply ignore the P/S without explanation as investors may be disregarding a distinct opportunity or a costly mistake.
See our latest analysis for PanAsialum Holdings
What Does PanAsialum Holdings' Recent Performance Look Like?
As an illustration, revenue has deteriorated at PanAsialum Holdings over the last year, which is not ideal at all. It might be that many expect the company to put the disappointing revenue performance behind them over the coming period, which has kept the P/S from falling. If you like the company, you'd at least be hoping this is the case so that you could potentially pick up some stock while it's not quite in favour.
Although there are no analyst estimates available for PanAsialum Holdings, take a look at this free data-rich visualisation to see how the company stacks up on earnings, revenue and cash flow.What Are Revenue Growth Metrics Telling Us About The P/S?
The only time you'd be comfortable seeing a P/S like PanAsialum Holdings' is when the company's growth is tracking the industry closely.
Taking a look back first, the company's revenue growth last year wasn't something to get excited about as it posted a disappointing decline of 11%. The last three years don't look nice either as the company has shrunk revenue by 49% in aggregate. Accordingly, shareholders would have felt downbeat about the medium-term rates of revenue growth.
Weighing that medium-term revenue trajectory against the broader industry's one-year forecast for expansion of 24% shows it's an unpleasant look.
In light of this, it's somewhat alarming that PanAsialum Holdings' P/S sits in line with the majority of other companies. It seems most investors are ignoring the recent poor growth rate and are hoping for a turnaround in the company's business prospects. There's a good chance existing shareholders are setting themselves up for future disappointment if the P/S falls to levels more in line with the recent negative growth rates.
The Key Takeaway
Following PanAsialum Holdings' share price tumble, its P/S is just clinging on to the industry median P/S. Using the price-to-sales ratio alone to determine if you should sell your stock isn't sensible, however it can be a practical guide to the company's future prospects.
We find it unexpected that PanAsialum Holdings trades at a P/S ratio that is comparable to the rest of the industry, despite experiencing declining revenues during the medium-term, while the industry as a whole is expected to grow. When we see revenue heading backwards in the context of growing industry forecasts, it'd make sense to expect a possible share price decline on the horizon, sending the moderate P/S lower. If recent medium-term revenue trends continue, it will place shareholders' investments at risk and potential investors in danger of paying an unnecessary premium.
And what about other risks? Every company has them, and we've spotted 3 warning signs for PanAsialum Holdings (of which 1 doesn't sit too well with us!) you should know about.
If you're unsure about the strength of PanAsialum Holdings' business, why not explore our interactive list of stocks with solid business fundamentals for some other companies you may have missed.
New: Manage All Your Stock Portfolios in One Place
We've created the ultimate portfolio companion for stock investors, and it's free.
• Connect an unlimited number of Portfolios and see your total in one currency
• Be alerted to new Warning Signs or Risks via email or mobile
• Track the Fair Value of your stocks
Have feedback on this article? Concerned about the content? Get in touch with us directly. Alternatively, email editorial-team (at) simplywallst.com.
This article by Simply Wall St is general in nature. We provide commentary based on historical data and analyst forecasts only using an unbiased methodology and our articles are not intended to be financial advice. It does not constitute a recommendation to buy or sell any stock, and does not take account of your objectives, or your financial situation. We aim to bring you long-term focused analysis driven by fundamental data. Note that our analysis may not factor in the latest price-sensitive company announcements or qualitative material. Simply Wall St has no position in any stocks mentioned.
About SEHK:2078
PanAsialum Holdings
An investment holding company, manufactures and trades in aluminum products in the People's Republic of China, Australia, South East Asia, and internationally.
Adequate balance sheet and slightly overvalued.
Market Insights

Advertisement
Community Narratives
MicroVision will explode future revenue by 380.37% with a vision towards success
Fair Value US$60.00|98.4% undervalued
TH
Community Contributor
The Indispensable Artery for a New North American Economy
Fair Value CA$132.87|1.3% undervalued
TI
Community Contributor