
Advertisement
- Hong Kong
- /
- Tech Hardware
- /
- SEHK:2028
Jolimark Holdings Limited's (HKG:2028) 28% Dip Still Leaving Some Shareholders Feeling Restless Over Its P/SRatio
Jolimark Holdings Limited (HKG:2028) shares have had a horrible month, losing 28% after a relatively good period beforehand. For any long-term shareholders, the last month ends a year to forget by locking in a 50% share price decline.
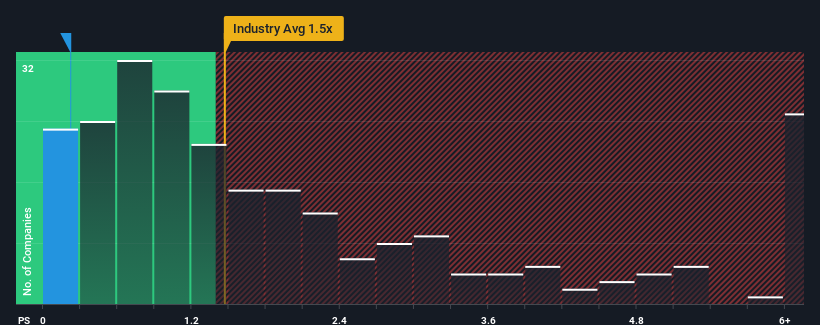
In spite of the heavy fall in price, there still wouldn't be many who think Jolimark Holdings' price-to-sales (or "P/S") ratio of 0.2x is worth a mention when the median P/S in Hong Kong's Tech industry is similar at about 0.4x. However, investors might be overlooking a clear opportunity or potential setback if there is no rational basis for the P/S.
Check out our latest analysis for Jolimark Holdings
What Does Jolimark Holdings' P/S Mean For Shareholders?
For example, consider that Jolimark Holdings' financial performance has been poor lately as its revenue has been in decline. Perhaps investors believe the recent revenue performance is enough to keep in line with the industry, which is keeping the P/S from dropping off. If not, then existing shareholders may be a little nervous about the viability of the share price.
Although there are no analyst estimates available for Jolimark Holdings, take a look at this free data-rich visualisation to see how the company stacks up on earnings, revenue and cash flow.Do Revenue Forecasts Match The P/S Ratio?
There's an inherent assumption that a company should be matching the industry for P/S ratios like Jolimark Holdings' to be considered reasonable.
In reviewing the last year of financials, we were disheartened to see the company's revenues fell to the tune of 27%. The last three years don't look nice either as the company has shrunk revenue by 26% in aggregate. Therefore, it's fair to say the revenue growth recently has been undesirable for the company.
In contrast to the company, the rest of the industry is expected to grow by 19% over the next year, which really puts the company's recent medium-term revenue decline into perspective.
With this in mind, we find it worrying that Jolimark Holdings' P/S exceeds that of its industry peers. It seems most investors are ignoring the recent poor growth rate and are hoping for a turnaround in the company's business prospects. Only the boldest would assume these prices are sustainable as a continuation of recent revenue trends is likely to weigh on the share price eventually.
The Final Word
With its share price dropping off a cliff, the P/S for Jolimark Holdings looks to be in line with the rest of the Tech industry. Typically, we'd caution against reading too much into price-to-sales ratios when settling on investment decisions, though it can reveal plenty about what other market participants think about the company.
We find it unexpected that Jolimark Holdings trades at a P/S ratio that is comparable to the rest of the industry, despite experiencing declining revenues during the medium-term, while the industry as a whole is expected to grow. When we see revenue heading backwards in the context of growing industry forecasts, it'd make sense to expect a possible share price decline on the horizon, sending the moderate P/S lower. Unless the the circumstances surrounding the recent medium-term improve, it wouldn't be wrong to expect a a difficult period ahead for the company's shareholders.
Having said that, be aware Jolimark Holdings is showing 3 warning signs in our investment analysis, you should know about.
If these risks are making you reconsider your opinion on Jolimark Holdings, explore our interactive list of high quality stocks to get an idea of what else is out there.
New: Manage All Your Stock Portfolios in One Place
We've created the ultimate portfolio companion for stock investors, and it's free.
• Connect an unlimited number of Portfolios and see your total in one currency
• Be alerted to new Warning Signs or Risks via email or mobile
• Track the Fair Value of your stocks
Have feedback on this article? Concerned about the content? Get in touch with us directly. Alternatively, email editorial-team (at) simplywallst.com.
This article by Simply Wall St is general in nature. We provide commentary based on historical data and analyst forecasts only using an unbiased methodology and our articles are not intended to be financial advice. It does not constitute a recommendation to buy or sell any stock, and does not take account of your objectives, or your financial situation. We aim to bring you long-term focused analysis driven by fundamental data. Note that our analysis may not factor in the latest price-sensitive company announcements or qualitative material. Simply Wall St has no position in any stocks mentioned.
About SEHK:2028
Jolimark Holdings
An investment holding company, manufactures and sells printers, and other electronic and non-electronic products in the People’s Republic of China.
Moderate risk and slightly overvalued.
Market Insights

Advertisement
Community Narratives
MicroVision will explode future revenue by 380.37% with a vision towards success
Fair Value US$60.00|98.5% undervalued
TH
Community Contributor
The Indispensable Artery for a New North American Economy
Fair Value CA$132.87|2.3% undervalued
TI
Community Contributor