- Hong Kong
- /
- Electronic Equipment and Components
- /
- SEHK:1725
Further weakness as USPACE Technology Group (HKG:1725) drops 12% this week, taking one-year losses to 85%

It's not a secret that every investor will make bad investments, from time to time. But it's not unreasonable to try to avoid truly shocking capital losses. So spare a thought for the long term shareholders of USPACE Technology Group Limited (HKG:1725); the share price is down a whopping 85% in the last twelve months. While some investors are willing to stomach this sort of loss, they are usually professionals who spread their bets thinly. At least the damage isn't so bad if you look at the last three years, since the stock is down 19% in that time. Furthermore, it's down 49% in about a quarter. That's not much fun for holders. We note that the company has reported results fairly recently; and the market is hardly delighted. You can check out the latest numbers in our company report. We really hope anyone holding through that price crash has a diversified portfolio. Even when you lose money, you don't have to lose the lesson.
Given the past week has been tough on shareholders, let's investigate the fundamentals and see what we can learn.
View our latest analysis for USPACE Technology Group
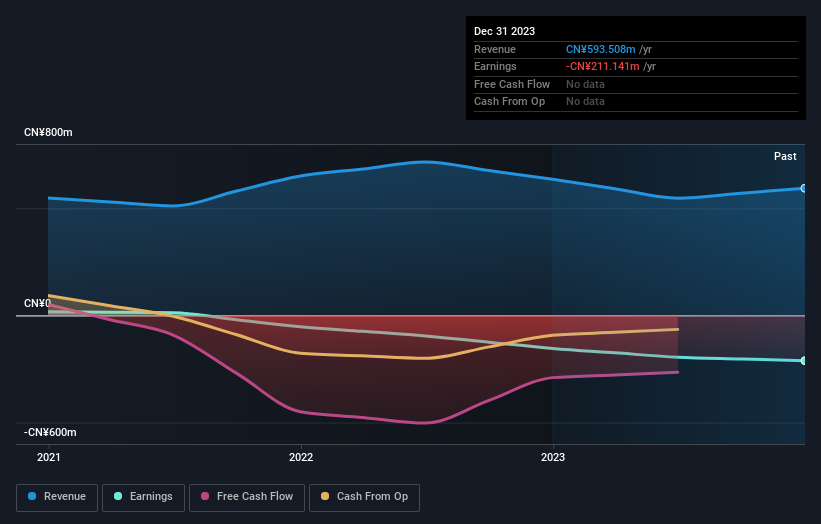
USPACE Technology Group wasn't profitable in the last twelve months, it is unlikely we'll see a strong correlation between its share price and its earnings per share (EPS). Arguably revenue is our next best option. When a company doesn't make profits, we'd generally hope to see good revenue growth. Some companies are willing to postpone profitability to grow revenue faster, but in that case one would hope for good top-line growth to make up for the lack of earnings.
In just one year USPACE Technology Group saw its revenue fall by 6.6%. That looks pretty grim, at a glance. The market obviously agrees, since the share price tanked 85%. Holders should not lose the lesson: loss making companies should grow revenue. But markets do over-react, so there opportunity for investors who are willing to take the time to dig deeper and understand the business.
You can see how earnings and revenue have changed over time in the image below (click on the chart to see the exact values).
You can see how its balance sheet has strengthened (or weakened) over time in this free interactive graphic.
A Different Perspective
We regret to report that USPACE Technology Group shareholders are down 85% for the year. Unfortunately, that's worse than the broader market decline of 9.9%. Having said that, it's inevitable that some stocks will be oversold in a falling market. The key is to keep your eyes on the fundamental developments. Longer term investors wouldn't be so upset, since they would have made 1.6%, each year, over five years. It could be that the recent sell-off is an opportunity, so it may be worth checking the fundamental data for signs of a long term growth trend. I find it very interesting to look at share price over the long term as a proxy for business performance. But to truly gain insight, we need to consider other information, too. For instance, we've identified 5 warning signs for USPACE Technology Group (2 don't sit too well with us) that you should be aware of.
Of course, you might find a fantastic investment by looking elsewhere. So take a peek at this free list of companies we expect will grow earnings.
Please note, the market returns quoted in this article reflect the market weighted average returns of stocks that currently trade on Hong Kong exchanges.
New: AI Stock Screener & Alerts
Our new AI Stock Screener scans the market every day to uncover opportunities.
• Dividend Powerhouses (3%+ Yield)
• Undervalued Small Caps with Insider Buying
• High growth Tech and AI Companies
Or build your own from over 50 metrics.
Have feedback on this article? Concerned about the content? Get in touch with us directly. Alternatively, email editorial-team (at) simplywallst.com.
This article by Simply Wall St is general in nature. We provide commentary based on historical data and analyst forecasts only using an unbiased methodology and our articles are not intended to be financial advice. It does not constitute a recommendation to buy or sell any stock, and does not take account of your objectives, or your financial situation. We aim to bring you long-term focused analysis driven by fundamental data. Note that our analysis may not factor in the latest price-sensitive company announcements or qualitative material. Simply Wall St has no position in any stocks mentioned.
About SEHK:1725
USPACE Technology Group
An investment holding company, provides electronics manufacturing services in the People's Republic of China, the United States, India, South Korea, Austria, Hong Kong, Germany, Vietnam, Australia, and internationally.
Slight with mediocre balance sheet.
