Advertisement
- Hong Kong
- /
- Electronic Equipment and Components
- /
- SEHK:1723
Moon (SEHK:1723): Losses Accelerate 74.3% Annually as Valuation Gaps Widen Before Earnings

Simply Wall St
Reviewed by Simply Wall St
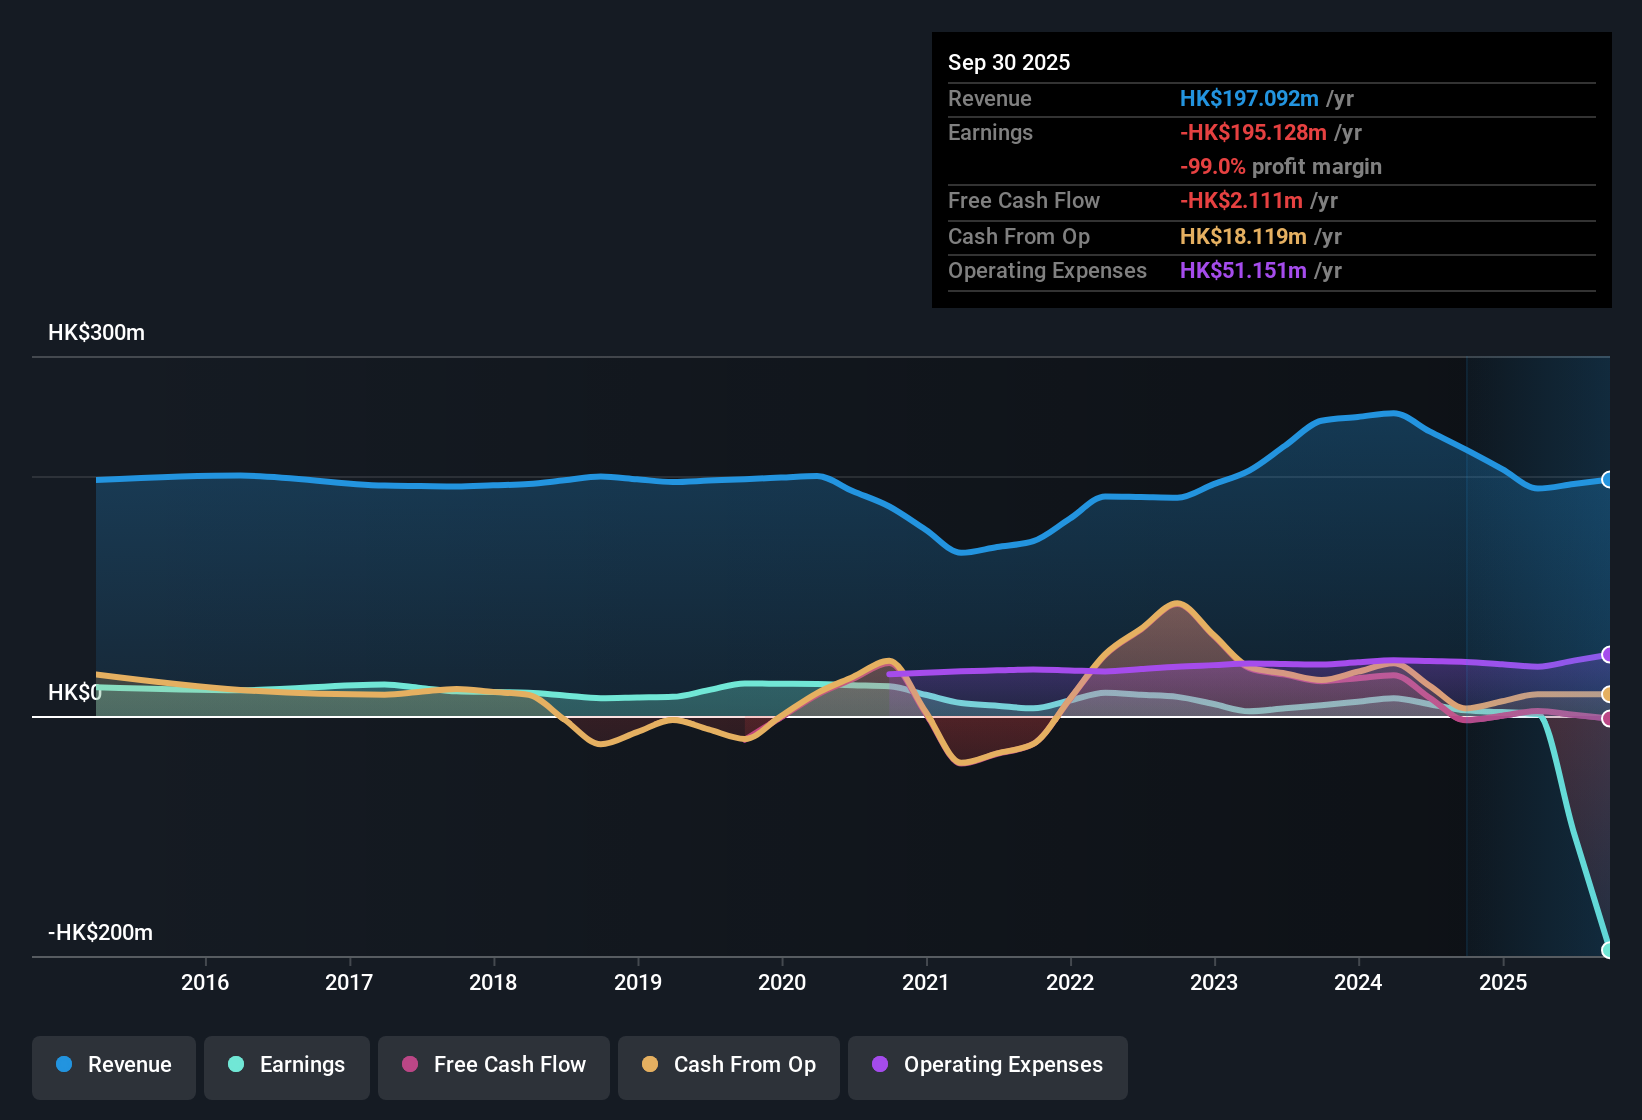
Moon (SEHK:1723) remains unprofitable, with losses accelerating at a rapid pace of 74.3% per year over the last five years and no improvement in margins. The company’s shares are trading at a steep Price-to-Sales Ratio of 7.4x, far surpassing both its peer average of 0.1x and the broader Hong Kong electronic industry average of 0.5x. This implies that the current market price of HK$3.06 is well above the estimated fair value of HK$0.23. With no signs of profit growth, continued share dilution, and rising losses, investors are met with financial risks and little in the way of quantifiable upside based on the latest filing.
See our full analysis for Moon.The next section takes these key numbers and puts them head-to-head with the main stories circulating in the market. This reveals which narratives hold up and which could use a second look.
Curious how numbers become stories that shape markets? Explore Community Narratives
Losses Accelerate Far Outpacing Peers
- Moon’s net losses have increased at a rapid annual pace of 74.3% over the past five years, signaling persistent operating challenges and sharply negative momentum compared to both peers and the industry.
- Critics highlight that this relentless pace of loss expansion severely weakens the margin for any near-term turnaround.
- Bears point out that, with no evidence of profit growth acceleration or margin improvement, even cost-cutting or restructuring is unlikely to reverse these deepening losses on its own.
- The lack of any positive profit trend, especially when peers are seeing stable or improving margins, makes the bearish narrative hard to counter using the current figures.
Share Price Rides High Above DCF Fair Value
- The current share price of HK$3.06 stands more than 13 times higher than the DCF fair value estimate of HK$0.23. The Price-to-Sales Ratio of 7.4x is far above the peer average of 0.1x and industry average of 0.5x.
- What is surprising is that despite this premium, there are no reward statements or signs of growth to justify paying such a high multiple.
- The vast disconnect between share price and fair value suggests that investors may be betting on future catalysts that do not have quantitative backing from reported results.
- Without operational momentum or external drivers noted in filings, the premium price tag is a clear red flag for value-focused investors. This situation further reinforces caution.
Share Dilution and Volatility Undermine Confidence
- Over the past year, Moon’s shareholders have faced both share dilution and significant price instability, as the share price movement has been notably erratic in the last three months.
- The prevailing market view questions whether the combined effect of dilution and price swings leaves little room for upside.
- Continued dilution not only reduces existing shareholders’ stake and potential returns, but when paired with ongoing losses, heightens perceived risk.
- Frequent price volatility, absent any offsetting growth catalysts or positive earnings signals, typically undermines institutional confidence and could limit future capital access.
Next Steps
Don't just look at this quarter; the real story is in the long-term trend. We've done an in-depth analysis on Moon's growth and its valuation to see if today's price is a bargain. Add the company to your watchlist or portfolio now so you don't miss the next big move.
See What Else Is Out There
Moon's accelerating losses, widening disconnect from fair value, and ongoing dilution indicate severe financial instability and persistent risk for investors.
If you want to sidestep companies with shaky finances, seek out those with stronger financial health and resilience using our solid balance sheet and fundamentals stocks screener (1972 results).
This article by Simply Wall St is general in nature. We provide commentary based on historical data and analyst forecasts only using an unbiased methodology and our articles are not intended to be financial advice. It does not constitute a recommendation to buy or sell any stock, and does not take account of your objectives, or your financial situation. We aim to bring you long-term focused analysis driven by fundamental data. Note that our analysis may not factor in the latest price-sensitive company announcements or qualitative material. Simply Wall St has no position in any stocks mentioned.
New: Manage All Your Stock Portfolios in One Place
We've created the ultimate portfolio companion for stock investors, and it's free.
• Connect an unlimited number of Portfolios and see your total in one currency
• Be alerted to new Warning Signs or Risks via email or mobile
• Track the Fair Value of your stocks
Have feedback on this article? Concerned about the content? Get in touch with us directly. Alternatively, email editorial-team@simplywallst.com
About SEHK:1723
Moon
An investment holding company, engages in the wholesale and retail sale of the pre-paid products in Hong Kong.
Flawless balance sheet with low risk.
Market Insights

Advertisement
Community Narratives
The company that turned a verb into a global necessity and basically runs the modern internet, digital ads, smartphones, maps, and AI.
Fair Value US$300.00|6.3% undervalued
OS
Community Contributor
Flowers Foods Pays A Fair Price For Health
Fair Value US$16.12|26.0% undervalued
NV
Community Contributor
TMX Group will thrive with 33.3% profit margin and enduring market moat
Fair Value CA$49.90|3.7% overvalued
LI
Community Contributor