
Advertisement
- Hong Kong
- /
- Electronic Equipment and Components
- /
- SEHK:1708
Would Nanjing Sample Technology (HKG:1708) Be Better Off With Less Debt?
Howard Marks put it nicely when he said that, rather than worrying about share price volatility, 'The possibility of permanent loss is the risk I worry about... and every practical investor I know worries about.' It's only natural to consider a company's balance sheet when you examine how risky it is, since debt is often involved when a business collapses. We can see that Nanjing Sample Technology Company Limited (HKG:1708) does use debt in its business. But is this debt a concern to shareholders?
Why Does Debt Bring Risk?
Debt assists a business until the business has trouble paying it off, either with new capital or with free cash flow. If things get really bad, the lenders can take control of the business. However, a more frequent (but still costly) occurrence is where a company must issue shares at bargain-basement prices, permanently diluting shareholders, just to shore up its balance sheet. Of course, the upside of debt is that it often represents cheap capital, especially when it replaces dilution in a company with the ability to reinvest at high rates of return. When we think about a company's use of debt, we first look at cash and debt together.
See our latest analysis for Nanjing Sample Technology
What Is Nanjing Sample Technology's Net Debt?
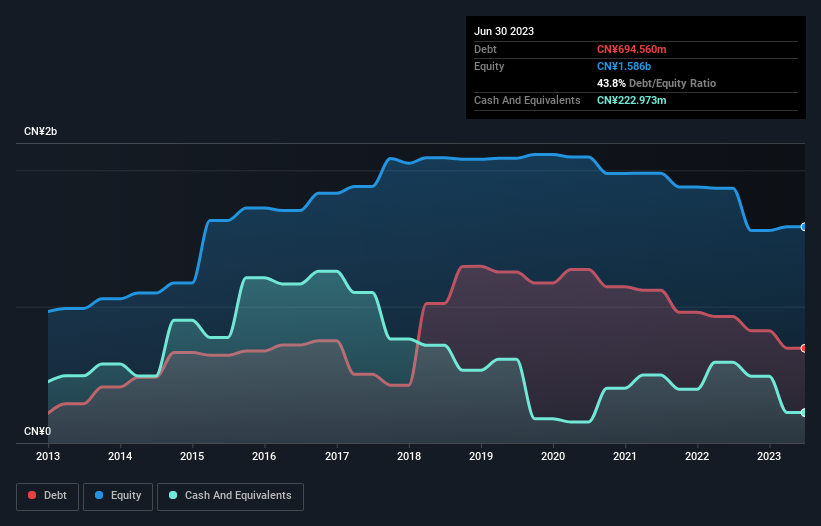
You can click the graphic below for the historical numbers, but it shows that Nanjing Sample Technology had CN¥694.6m of debt in June 2023, down from CN¥928.0m, one year before. On the flip side, it has CN¥223.0m in cash leading to net debt of about CN¥471.6m.
A Look At Nanjing Sample Technology's Liabilities
We can see from the most recent balance sheet that Nanjing Sample Technology had liabilities of CN¥1.17b falling due within a year, and liabilities of CN¥101.8m due beyond that. Offsetting these obligations, it had cash of CN¥223.0m as well as receivables valued at CN¥1.33b due within 12 months. So it can boast CN¥271.8m more liquid assets than total liabilities.
This excess liquidity suggests that Nanjing Sample Technology is taking a careful approach to debt. Due to its strong net asset position, it is not likely to face issues with its lenders. The balance sheet is clearly the area to focus on when you are analysing debt. But it is Nanjing Sample Technology's earnings that will influence how the balance sheet holds up in the future. So if you're keen to discover more about its earnings, it might be worth checking out this graph of its long term earnings trend.
In the last year Nanjing Sample Technology had a loss before interest and tax, and actually shrunk its revenue by 69%, to CN¥274m. To be frank that doesn't bode well.
Caveat Emptor
While Nanjing Sample Technology's falling revenue is about as heartwarming as a wet blanket, arguably its earnings before interest and tax (EBIT) loss is even less appealing. Indeed, it lost CN¥125m at the EBIT level. Looking on the brighter side, the business has adequate liquid assets, which give it time to grow and develop before its debt becomes a near-term issue. But we'd want to see some positive free cashflow before spending much time on trying to understand the stock. So it seems too risky for our taste. When analysing debt levels, the balance sheet is the obvious place to start. However, not all investment risk resides within the balance sheet - far from it. Case in point: We've spotted 1 warning sign for Nanjing Sample Technology you should be aware of.
If you're interested in investing in businesses that can grow profits without the burden of debt, then check out this free list of growing businesses that have net cash on the balance sheet.
Valuation is complex, but we're here to simplify it.
Discover if Nanjing Sample Technology might be undervalued or overvalued with our detailed analysis, featuring fair value estimates, potential risks, dividends, insider trades, and its financial condition.
Access Free AnalysisHave feedback on this article? Concerned about the content? Get in touch with us directly. Alternatively, email editorial-team (at) simplywallst.com.
This article by Simply Wall St is general in nature. We provide commentary based on historical data and analyst forecasts only using an unbiased methodology and our articles are not intended to be financial advice. It does not constitute a recommendation to buy or sell any stock, and does not take account of your objectives, or your financial situation. We aim to bring you long-term focused analysis driven by fundamental data. Note that our analysis may not factor in the latest price-sensitive company announcements or qualitative material. Simply Wall St has no position in any stocks mentioned.
About SEHK:1708
Nanjing Sample Technology
Provides visual identification and radio frequency identification (RFID) solutions to intelligent transportation, customs logistics, and other application areas in the People’s Republic of China.
Adequate balance sheet with very low risk.
Similar Companies
Market Insights

Advertisement
Community Narratives
MicroVision will explode future revenue by 380.37% with a vision towards success
Fair Value US$60|98.4% undervalued
TH
Community Contributor
The Indispensable Artery for a New North American Economy
Fair Value CA$132.87|1.6% undervalued
TI
Community Contributor
Recently Updated Narratives
BE


Bejgal on MINISO Group Holding ·
MINISO's fair value is projected at 26.69 with an anticipated PE ratio shift of 20x
Fair Value:US$26.6928.0% undervalued
44 followersusers have followed this narrative
3 commentsusers have commented on this narrative
0 likesusers have liked this narrative
TI


TickerTickle on Oracle ·
The Quiet Giant That Became AI’s Power Grid
Fair Value:US$389.8149.5% undervalued
7 followersusers have followed this narrative
1 commentusers have commented on this narrative
0 likesusers have liked this narrative
AU

AuCA on Nova Ljubljanska Banka d.d ·
Nova Ljubljanska Banka d.d will expect a 11.2% revenue boost driving future growth
Fair Value:€20916.5% undervalued
23 followersusers have followed this narrative
3 commentsusers have commented on this narrative
0 likesusers have liked this narrative
Popular Narratives
OS


oscargarcia on Alphabet ·
The company that turned a verb into a global necessity and basically runs the modern internet, digital ads, smartphones, maps, and AI.
Fair Value:US$3404.9% undervalued
136 followersusers have followed this narrative
6 commentsusers have commented on this narrative
18 likesusers have liked this narrative
TH

TheWallstreetKing on MicroVision ·
MicroVision will explode future revenue by 380.37% with a vision towards success
Fair Value:US$6098.4% undervalued
87 followersusers have followed this narrative
11 commentsusers have commented on this narrative
18 likesusers have liked this narrative
AN


AnalystConsensusTarget on NVIDIA ·
NVDA: Expanding AI Demand Will Drive Major Data Center Investments Through 2026
Fair Value:US$232.7923.6% undervalued
925 followersusers have followed this narrative
6 commentsusers have commented on this narrative
22 likesusers have liked this narrative