
Advertisement
- Hong Kong
- /
- Electronic Equipment and Components
- /
- SEHK:1708
Nanjing Sample Technology (HKG:1708) Will Be Looking To Turn Around Its Returns
What financial metrics can indicate to us that a company is maturing or even in decline? Businesses in decline often have two underlying trends, firstly, a declining return on capital employed (ROCE) and a declining base of capital employed. Ultimately this means that the company is earning less per dollar invested and on top of that, it's shrinking its base of capital employed. And from a first read, things don't look too good at Nanjing Sample Technology (HKG:1708), so let's see why.
What Is Return On Capital Employed (ROCE)?
If you haven't worked with ROCE before, it measures the 'return' (pre-tax profit) a company generates from capital employed in its business. Analysts use this formula to calculate it for Nanjing Sample Technology:
Return on Capital Employed = Earnings Before Interest and Tax (EBIT) ÷ (Total Assets - Current Liabilities)
0.0051 = CN¥10m ÷ (CN¥3.4b - CN¥1.4b) (Based on the trailing twelve months to June 2022).
So, Nanjing Sample Technology has an ROCE of 0.5%. Ultimately, that's a low return and it under-performs the Electronic industry average of 7.3%.
Our analysis indicates that 1708 is potentially undervalued!
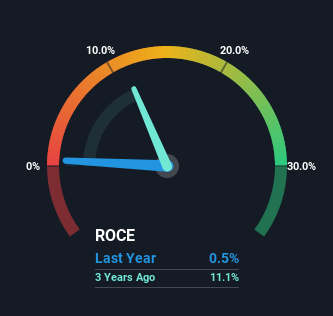
Historical performance is a great place to start when researching a stock so above you can see the gauge for Nanjing Sample Technology's ROCE against it's prior returns. If you'd like to look at how Nanjing Sample Technology has performed in the past in other metrics, you can view this free graph of past earnings, revenue and cash flow.
The Trend Of ROCE
In terms of Nanjing Sample Technology's historical ROCE movements, the trend doesn't inspire confidence. About five years ago, returns on capital were 10%, however they're now substantially lower than that as we saw above. And on the capital employed front, the business is utilizing roughly the same amount of capital as it was back then. This combination can be indicative of a mature business that still has areas to deploy capital, but the returns received aren't as high due potentially to new competition or smaller margins. So because these trends aren't typically conducive to creating a multi-bagger, we wouldn't hold our breath on Nanjing Sample Technology becoming one if things continue as they have.
On a side note, Nanjing Sample Technology's current liabilities are still rather high at 42% of total assets. This effectively means that suppliers (or short-term creditors) are funding a large portion of the business, so just be aware that this can introduce some elements of risk. While it's not necessarily a bad thing, it can be beneficial if this ratio is lower.
The Key Takeaway
In the end, the trend of lower returns on the same amount of capital isn't typically an indication that we're looking at a growth stock. We expect this has contributed to the stock plummeting 70% during the last five years. That being the case, unless the underlying trends revert to a more positive trajectory, we'd consider looking elsewhere.
Like most companies, Nanjing Sample Technology does come with some risks, and we've found 1 warning sign that you should be aware of.
If you want to search for solid companies with great earnings, check out this free list of companies with good balance sheets and impressive returns on equity.
Valuation is complex, but we're here to simplify it.
Discover if Nanjing Sample Technology might be undervalued or overvalued with our detailed analysis, featuring fair value estimates, potential risks, dividends, insider trades, and its financial condition.
Access Free AnalysisHave feedback on this article? Concerned about the content? Get in touch with us directly. Alternatively, email editorial-team (at) simplywallst.com.
This article by Simply Wall St is general in nature. We provide commentary based on historical data and analyst forecasts only using an unbiased methodology and our articles are not intended to be financial advice. It does not constitute a recommendation to buy or sell any stock, and does not take account of your objectives, or your financial situation. We aim to bring you long-term focused analysis driven by fundamental data. Note that our analysis may not factor in the latest price-sensitive company announcements or qualitative material. Simply Wall St has no position in any stocks mentioned.
About SEHK:1708
Nanjing Sample Technology
Provides visual identification and radio frequency identification (RFID) solutions to intelligent transportation, customs logistics, and other application areas in the People’s Republic of China.
Adequate balance sheet with very low risk.
Similar Companies
Market Insights

Advertisement
Community Narratives
MicroVision will explode future revenue by 380.37% with a vision towards success
Fair Value US$60.00|98.4% undervalued
TH
Community Contributor
The Indispensable Artery for a New North American Economy
Fair Value CA$132.87|1.3% undervalued
TI
Community Contributor