
Advertisement
- Hong Kong
- /
- Electronic Equipment and Components
- /
- SEHK:1708
Is Nanjing Sample Technology (HKG:1708) A Risky Investment?
Howard Marks put it nicely when he said that, rather than worrying about share price volatility, 'The possibility of permanent loss is the risk I worry about... and every practical investor I know worries about.' It's only natural to consider a company's balance sheet when you examine how risky it is, since debt is often involved when a business collapses. Importantly, Nanjing Sample Technology Company Limited (HKG:1708) does carry debt. But is this debt a concern to shareholders?
Why Does Debt Bring Risk?
Debt is a tool to help businesses grow, but if a business is incapable of paying off its lenders, then it exists at their mercy. In the worst case scenario, a company can go bankrupt if it cannot pay its creditors. However, a more frequent (but still costly) occurrence is where a company must issue shares at bargain-basement prices, permanently diluting shareholders, just to shore up its balance sheet. Of course, the upside of debt is that it often represents cheap capital, especially when it replaces dilution in a company with the ability to reinvest at high rates of return. When we examine debt levels, we first consider both cash and debt levels, together.
View our latest analysis for Nanjing Sample Technology
What Is Nanjing Sample Technology's Net Debt?
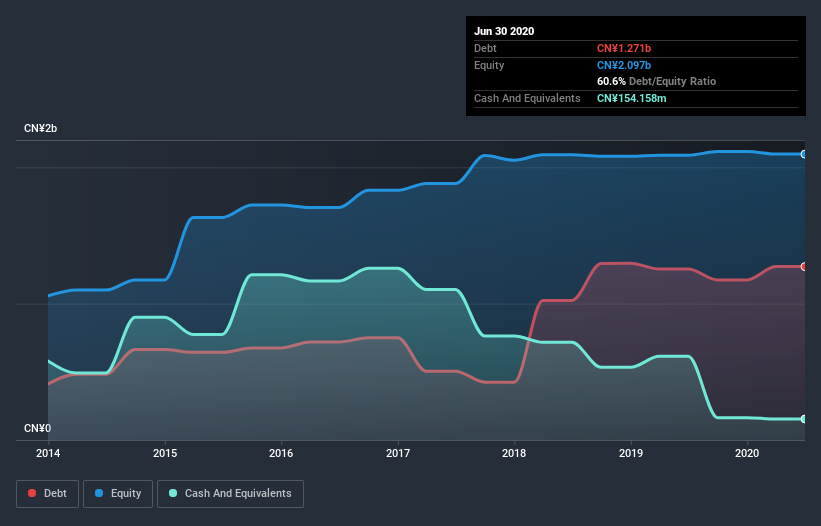
The chart below, which you can click on for greater detail, shows that Nanjing Sample Technology had CN¥1.27b in debt in June 2020; about the same as the year before. However, it also had CN¥154.2m in cash, and so its net debt is CN¥1.12b.
How Strong Is Nanjing Sample Technology's Balance Sheet?
Zooming in on the latest balance sheet data, we can see that Nanjing Sample Technology had liabilities of CN¥2.20b due within 12 months and liabilities of CN¥156.5m due beyond that. Offsetting these obligations, it had cash of CN¥154.2m as well as receivables valued at CN¥2.19b due within 12 months. So its total liabilities are just about perfectly matched by its shorter-term, liquid assets.
Having regard to Nanjing Sample Technology's size, it seems that its liquid assets are well balanced with its total liabilities. So it's very unlikely that the CN¥1.32b company is short on cash, but still worth keeping an eye on the balance sheet.
We use two main ratios to inform us about debt levels relative to earnings. The first is net debt divided by earnings before interest, tax, depreciation, and amortization (EBITDA), while the second is how many times its earnings before interest and tax (EBIT) covers its interest expense (or its interest cover, for short). The advantage of this approach is that we take into account both the absolute quantum of debt (with net debt to EBITDA) and the actual interest expenses associated with that debt (with its interest cover ratio).
Nanjing Sample Technology shareholders face the double whammy of a high net debt to EBITDA ratio (6.6), and fairly weak interest coverage, since EBIT is just 1.6 times the interest expense. The debt burden here is substantial. Even worse, Nanjing Sample Technology saw its EBIT tank 68% over the last 12 months. If earnings continue to follow that trajectory, paying off that debt load will be harder than convincing us to run a marathon in the rain. The balance sheet is clearly the area to focus on when you are analysing debt. But it is Nanjing Sample Technology's earnings that will influence how the balance sheet holds up in the future. So if you're keen to discover more about its earnings, it might be worth checking out this graph of its long term earnings trend.
But our final consideration is also important, because a company cannot pay debt with paper profits; it needs cold hard cash. So we clearly need to look at whether that EBIT is leading to corresponding free cash flow. During the last three years, Nanjing Sample Technology burned a lot of cash. While investors are no doubt expecting a reversal of that situation in due course, it clearly does mean its use of debt is more risky.
Our View
To be frank both Nanjing Sample Technology's conversion of EBIT to free cash flow and its track record of (not) growing its EBIT make us rather uncomfortable with its debt levels. But at least it's pretty decent at staying on top of its total liabilities; that's encouraging. We're quite clear that we consider Nanjing Sample Technology to be really rather risky, as a result of its balance sheet health. So we're almost as wary of this stock as a hungry kitten is about falling into its owner's fish pond: once bitten, twice shy, as they say. When analysing debt levels, the balance sheet is the obvious place to start. But ultimately, every company can contain risks that exist outside of the balance sheet. Case in point: We've spotted 3 warning signs for Nanjing Sample Technology you should be aware of, and 2 of them shouldn't be ignored.
At the end of the day, it's often better to focus on companies that are free from net debt. You can access our special list of such companies (all with a track record of profit growth). It's free.
If you decide to trade Nanjing Sample Technology, use the lowest-cost* platform that is rated #1 Overall by Barron’s, Interactive Brokers. Trade stocks, options, futures, forex, bonds and funds on 135 markets, all from a single integrated account. Promoted
Valuation is complex, but we're here to simplify it.
Discover if Nanjing Sample Technology might be undervalued or overvalued with our detailed analysis, featuring fair value estimates, potential risks, dividends, insider trades, and its financial condition.
Access Free AnalysisThis article by Simply Wall St is general in nature. It does not constitute a recommendation to buy or sell any stock, and does not take account of your objectives, or your financial situation. We aim to bring you long-term focused analysis driven by fundamental data. Note that our analysis may not factor in the latest price-sensitive company announcements or qualitative material. Simply Wall St has no position in any stocks mentioned.
*Interactive Brokers Rated Lowest Cost Broker by StockBrokers.com Annual Online Review 2020
Have feedback on this article? Concerned about the content? Get in touch with us directly. Alternatively, email editorial-team@simplywallst.com.
About SEHK:1708
Nanjing Sample Technology
Provides visual identification and radio frequency identification (RFID) solutions to intelligent transportation, customs logistics, and other application areas in the People’s Republic of China.
Adequate balance sheet with very low risk.
Similar Companies
Market Insights

Advertisement
Community Narratives
MicroVision will explode future revenue by 380.37% with a vision towards success
Fair Value US$60.00|98.4% undervalued
TH
Community Contributor
The Indispensable Artery for a New North American Economy
Fair Value CA$132.87|1.3% undervalued
TI
Community Contributor