- Hong Kong
- /
- Electronic Equipment and Components
- /
- SEHK:1184
Could S.A.S. Dragon Holdings (HKG:1184) Multiply In Value?
Finding a business that has the potential to grow substantially is not easy, but it is possible if we look at a few key financial metrics. Firstly, we'll want to see a proven return on capital employed (ROCE) that is increasing, and secondly, an expanding base of capital employed. Basically this means that a company has profitable initiatives that it can continue to reinvest in, which is a trait of a compounding machine. Ergo, when we looked at the ROCE trends at S.A.S. Dragon Holdings (HKG:1184), we liked what we saw.
What is Return On Capital Employed (ROCE)?
If you haven't worked with ROCE before, it measures the 'return' (pre-tax profit) a company generates from capital employed in its business. Analysts use this formula to calculate it for S.A.S. Dragon Holdings:
Return on Capital Employed = Earnings Before Interest and Tax (EBIT) ÷ (Total Assets - Current Liabilities)
0.21 = HK$494m ÷ (HK$7.0b - HK$4.7b) (Based on the trailing twelve months to June 2020).
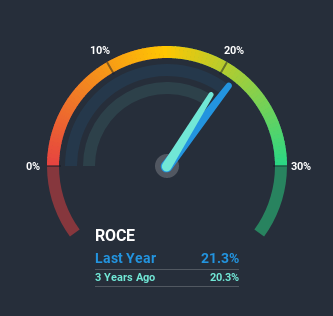
So, S.A.S. Dragon Holdings has an ROCE of 21%. That's a fantastic return and not only that, it outpaces the average of 7.7% earned by companies in a similar industry.
See our latest analysis for S.A.S. Dragon Holdings

Historical performance is a great place to start when researching a stock so above you can see the gauge for S.A.S. Dragon Holdings' ROCE against it's prior returns. If you want to delve into the historical earnings, revenue and cash flow of S.A.S. Dragon Holdings, check out these free graphs here.
So How Is S.A.S. Dragon Holdings' ROCE Trending?
It's hard not to be impressed by S.A.S. Dragon Holdings' returns on capital. The company has consistently earned 21% for the last five years, and the capital employed within the business has risen 127% in that time. With returns that high, it's great that the business can continually reinvest its money at such appealing rates of return. If these trends can continue, it wouldn't surprise us if the company became a multi-bagger.
On a side note, S.A.S. Dragon Holdings' current liabilities are still rather high at 67% of total assets. This can bring about some risks because the company is basically operating with a rather large reliance on its suppliers or other sorts of short-term creditors. Ideally we'd like to see this reduce as that would mean fewer obligations bearing risks.
The Bottom Line
In short, we'd argue S.A.S. Dragon Holdings has the makings of a multi-bagger since its been able to compound its capital at very profitable rates of return. And long term investors would be thrilled with the 217% return they've received over the last five years. So even though the stock might be more "expensive" than it was before, we think the strong fundamentals warrant this stock for further research.
If you'd like to know more about S.A.S. Dragon Holdings, we've spotted 3 warning signs, and 1 of them shouldn't be ignored.
High returns are a key ingredient to strong performance, so check out our free list ofstocks earning high returns on equity with solid balance sheets.
When trading S.A.S. Dragon Holdings or any other investment, use the platform considered by many to be the Professional's Gateway to the Worlds Market, Interactive Brokers. You get the lowest-cost* trading on stocks, options, futures, forex, bonds and funds worldwide from a single integrated account. Promoted
New: Manage All Your Stock Portfolios in One Place
We've created the ultimate portfolio companion for stock investors, and it's free.
• Connect an unlimited number of Portfolios and see your total in one currency
• Be alerted to new Warning Signs or Risks via email or mobile
• Track the Fair Value of your stocks
This article by Simply Wall St is general in nature. It does not constitute a recommendation to buy or sell any stock, and does not take account of your objectives, or your financial situation. We aim to bring you long-term focused analysis driven by fundamental data. Note that our analysis may not factor in the latest price-sensitive company announcements or qualitative material. Simply Wall St has no position in any stocks mentioned.
*Interactive Brokers Rated Lowest Cost Broker by StockBrokers.com Annual Online Review 2020
Have feedback on this article? Concerned about the content? Get in touch with us directly. Alternatively, email editorial-team (at) simplywallst.com.
About SEHK:1184
S.A.S. Dragon Holdings
An investment holding company, provides electronic supply chain services in Hong Kong, Mainland China, Taiwan, the United States, Vietnam, Singapore, Macao, and internationally.
Flawless balance sheet established dividend payer.
Similar Companies
Market Insights
Community Narratives


