The three-year loss for AsiaInfo Technologies (HKG:1675) shareholders likely driven by its shrinking earnings


Many investors define successful investing as beating the market average over the long term. But its virtually certain that sometimes you will buy stocks that fall short of the market average returns. Unfortunately, that's been the case for longer term AsiaInfo Technologies Limited (HKG:1675) shareholders, since the share price is down 57% in the last three years, falling well short of the market decline of around 1.2%. And over the last year the share price fell 37%, so we doubt many shareholders are delighted. Shareholders have had an even rougher run lately, with the share price down 22% in the last 90 days.
While the stock has risen 9.5% in the past week but long term shareholders are still in the red, let's see what the fundamentals can tell us.
See our latest analysis for AsiaInfo Technologies
While the efficient markets hypothesis continues to be taught by some, it has been proven that markets are over-reactive dynamic systems, and investors are not always rational. One imperfect but simple way to consider how the market perception of a company has shifted is to compare the change in the earnings per share (EPS) with the share price movement.
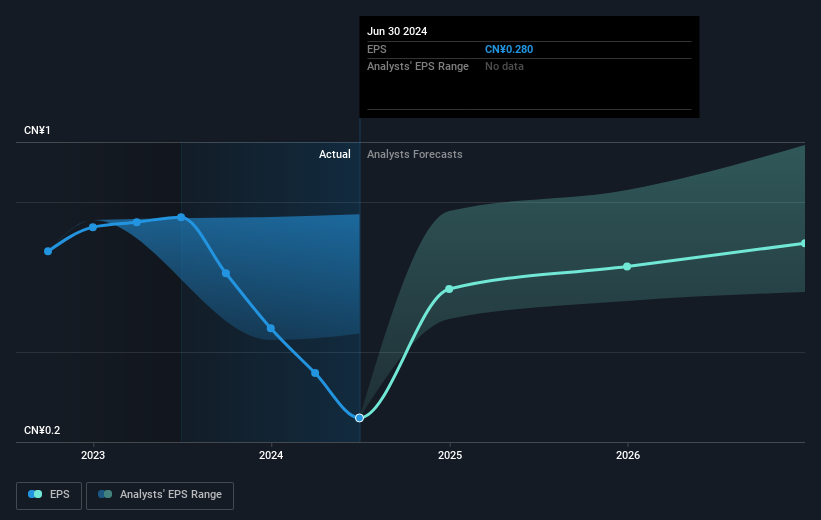
During the three years that the share price fell, AsiaInfo Technologies' earnings per share (EPS) dropped by 30% each year. This fall in the EPS is worse than the 25% compound annual share price fall. This suggests that the market retains some optimism around long term earnings stability, despite past EPS declines.
The image below shows how EPS has tracked over time (if you click on the image you can see greater detail).
This free interactive report on AsiaInfo Technologies' earnings, revenue and cash flow is a great place to start, if you want to investigate the stock further.
What About Dividends?
It is important to consider the total shareholder return, as well as the share price return, for any given stock. The TSR incorporates the value of any spin-offs or discounted capital raisings, along with any dividends, based on the assumption that the dividends are reinvested. So for companies that pay a generous dividend, the TSR is often a lot higher than the share price return. We note that for AsiaInfo Technologies the TSR over the last 3 years was -48%, which is better than the share price return mentioned above. And there's no prize for guessing that the dividend payments largely explain the divergence!
A Different Perspective
While the broader market gained around 19% in the last year, AsiaInfo Technologies shareholders lost 29% (even including dividends). Even the share prices of good stocks drop sometimes, but we want to see improvements in the fundamental metrics of a business, before getting too interested. Regrettably, last year's performance caps off a bad run, with the shareholders facing a total loss of 3% per year over five years. We realise that Baron Rothschild has said investors should "buy when there is blood on the streets", but we caution that investors should first be sure they are buying a high quality business. I find it very interesting to look at share price over the long term as a proxy for business performance. But to truly gain insight, we need to consider other information, too. Case in point: We've spotted 3 warning signs for AsiaInfo Technologies you should be aware of, and 1 of them is a bit unpleasant.
But note: AsiaInfo Technologies may not be the best stock to buy. So take a peek at this free list of interesting companies with past earnings growth (and further growth forecast).
Please note, the market returns quoted in this article reflect the market weighted average returns of stocks that currently trade on Hong Kong exchanges.
New: Manage All Your Stock Portfolios in One Place
We've created the ultimate portfolio companion for stock investors, and it's free.
• Connect an unlimited number of Portfolios and see your total in one currency
• Be alerted to new Warning Signs or Risks via email or mobile
• Track the Fair Value of your stocks
Have feedback on this article? Concerned about the content? Get in touch with us directly. Alternatively, email editorial-team (at) simplywallst.com.
This article by Simply Wall St is general in nature. We provide commentary based on historical data and analyst forecasts only using an unbiased methodology and our articles are not intended to be financial advice. It does not constitute a recommendation to buy or sell any stock, and does not take account of your objectives, or your financial situation. We aim to bring you long-term focused analysis driven by fundamental data. Note that our analysis may not factor in the latest price-sensitive company announcements or qualitative material. Simply Wall St has no position in any stocks mentioned.
About SEHK:1675
AsiaInfo Technologies
An investment holding company, offers telecom software products and related services for the communications, government affairs, finance, energy, transportation, and postal industries primarily in the People’s Republic of China.
Flawless balance sheet and good value.

