- Hong Kong
- /
- Specialty Stores
- /
- SEHK:3709
EEKA Fashion Holdings (HKG:3709) sheds 7.6% this week, as yearly returns fall more in line with earnings growth

Stock pickers are generally looking for stocks that will outperform the broader market. And while active stock picking involves risks (and requires diversification) it can also provide excess returns. For example, long term EEKA Fashion Holdings Limited (HKG:3709) shareholders have enjoyed a 40% share price rise over the last half decade, well in excess of the market decline of around 29% (not including dividends). On the other hand, the more recent gains haven't been so impressive, with shareholders gaining just 33% , including dividends .
In light of the stock dropping 7.6% in the past week, we want to investigate the longer term story, and see if fundamentals have been the driver of the company's positive five-year return.
Check out our latest analysis for EEKA Fashion Holdings
To paraphrase Benjamin Graham: Over the short term the market is a voting machine, but over the long term it's a weighing machine. By comparing earnings per share (EPS) and share price changes over time, we can get a feel for how investor attitudes to a company have morphed over time.
Over half a decade, EEKA Fashion Holdings managed to grow its earnings per share at 8.1% a year. So the EPS growth rate is rather close to the annualized share price gain of 7% per year. That suggests that the market sentiment around the company hasn't changed much over that time. Indeed, it would appear the share price is reacting to the EPS.
The image below shows how EPS has tracked over time (if you click on the image you can see greater detail).
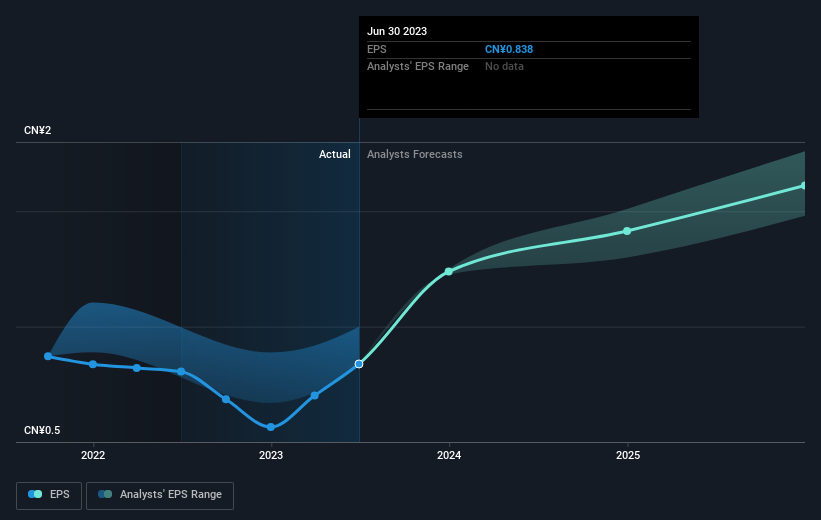
It might be well worthwhile taking a look at our free report on EEKA Fashion Holdings' earnings, revenue and cash flow.
What About Dividends?
It is important to consider the total shareholder return, as well as the share price return, for any given stock. The TSR is a return calculation that accounts for the value of cash dividends (assuming that any dividend received was reinvested) and the calculated value of any discounted capital raisings and spin-offs. So for companies that pay a generous dividend, the TSR is often a lot higher than the share price return. In the case of EEKA Fashion Holdings, it has a TSR of 66% for the last 5 years. That exceeds its share price return that we previously mentioned. This is largely a result of its dividend payments!
A Different Perspective
We're pleased to report that EEKA Fashion Holdings shareholders have received a total shareholder return of 33% over one year. And that does include the dividend. Since the one-year TSR is better than the five-year TSR (the latter coming in at 11% per year), it would seem that the stock's performance has improved in recent times. Given the share price momentum remains strong, it might be worth taking a closer look at the stock, lest you miss an opportunity. Before spending more time on EEKA Fashion Holdings it might be wise to click here to see if insiders have been buying or selling shares.
Of course EEKA Fashion Holdings may not be the best stock to buy. So you may wish to see this free collection of growth stocks.
Please note, the market returns quoted in this article reflect the market weighted average returns of stocks that currently trade on Hong Kong exchanges.
Valuation is complex, but we're here to simplify it.
Discover if EEKA Fashion Holdings might be undervalued or overvalued with our detailed analysis, featuring fair value estimates, potential risks, dividends, insider trades, and its financial condition.
Access Free AnalysisHave feedback on this article? Concerned about the content? Get in touch with us directly. Alternatively, email editorial-team (at) simplywallst.com.
This article by Simply Wall St is general in nature. We provide commentary based on historical data and analyst forecasts only using an unbiased methodology and our articles are not intended to be financial advice. It does not constitute a recommendation to buy or sell any stock, and does not take account of your objectives, or your financial situation. We aim to bring you long-term focused analysis driven by fundamental data. Note that our analysis may not factor in the latest price-sensitive company announcements or qualitative material. Simply Wall St has no position in any stocks mentioned.
About SEHK:3709
EEKA Fashion Holdings
An investment holding company, engages in the design, promotion, marketing, retail, and wholesale of self-owned branded ladies’ wear products in the People’s Republic of China.
Undervalued with solid track record.
