
Advertisement
- Hong Kong
- /
- Specialty Stores
- /
- SEHK:1959
Should We Be Excited About The Trends Of Returns At Centenary United Holdings (HKG:1959)?
If you're looking for a multi-bagger, there's a few things to keep an eye out for. Ideally, a business will show two trends; firstly a growing return on capital employed (ROCE) and secondly, an increasing amount of capital employed. Basically this means that a company has profitable initiatives that it can continue to reinvest in, which is a trait of a compounding machine. In light of that, when we looked at Centenary United Holdings (HKG:1959) and its ROCE trend, we weren't exactly thrilled.
What is Return On Capital Employed (ROCE)?
For those that aren't sure what ROCE is, it measures the amount of pre-tax profits a company can generate from the capital employed in its business. Analysts use this formula to calculate it for Centenary United Holdings:
Return on Capital Employed = Earnings Before Interest and Tax (EBIT) ÷ (Total Assets - Current Liabilities)
0.14 = CN¥38m ÷ (CN¥683m - CN¥406m) (Based on the trailing twelve months to June 2020).
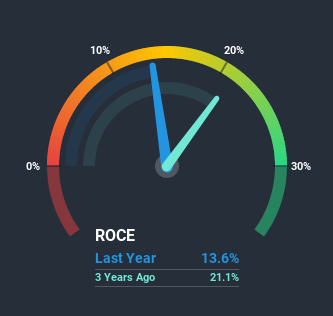
So, Centenary United Holdings has an ROCE of 14%. In absolute terms, that's a satisfactory return, but compared to the Specialty Retail industry average of 11% it's much better.
View our latest analysis for Centenary United Holdings
While the past is not representative of the future, it can be helpful to know how a company has performed historically, which is why we have this chart above. If you want to delve into the historical earnings, revenue and cash flow of Centenary United Holdings, check out these free graphs here.
What Can We Tell From Centenary United Holdings' ROCE Trend?
On the surface, the trend of ROCE at Centenary United Holdings doesn't inspire confidence. Around three years ago the returns on capital were 21%, but since then they've fallen to 14%. However it looks like Centenary United Holdings might be reinvesting for long term growth because while capital employed has increased, the company's sales haven't changed much in the last 12 months. It may take some time before the company starts to see any change in earnings from these investments.
On a related note, Centenary United Holdings has decreased its current liabilities to 59% of total assets. That could partly explain why the ROCE has dropped. Effectively this means their suppliers or short-term creditors are funding less of the business, which reduces some elements of risk. Some would claim this reduces the business' efficiency at generating ROCE since it is now funding more of the operations with its own money. Keep in mind 59% is still pretty high, so those risks are still somewhat prevalent.
Our Take On Centenary United Holdings' ROCE
Bringing it all together, while we're somewhat encouraged by Centenary United Holdings' reinvestment in its own business, we're aware that returns are shrinking. Investors must think there's better things to come because the stock has knocked it out of the park, delivering a 163% gain to shareholders who have held over the last year. But if the trajectory of these underlying trends continue, we think the likelihood of it being a multi-bagger from here isn't high.
One more thing: We've identified 4 warning signs with Centenary United Holdings (at least 1 which is concerning) , and understanding them would certainly be useful.
If you want to search for solid companies with great earnings, check out this free list of companies with good balance sheets and impressive returns on equity.
If you decide to trade Centenary United Holdings, use the lowest-cost* platform that is rated #1 Overall by Barron’s, Interactive Brokers. Trade stocks, options, futures, forex, bonds and funds on 135 markets, all from a single integrated account. Promoted
New: AI Stock Screener & Alerts
Our new AI Stock Screener scans the market every day to uncover opportunities.
• Dividend Powerhouses (3%+ Yield)
• Undervalued Small Caps with Insider Buying
• High growth Tech and AI Companies
Or build your own from over 50 metrics.
This article by Simply Wall St is general in nature. It does not constitute a recommendation to buy or sell any stock, and does not take account of your objectives, or your financial situation. We aim to bring you long-term focused analysis driven by fundamental data. Note that our analysis may not factor in the latest price-sensitive company announcements or qualitative material. Simply Wall St has no position in any stocks mentioned.
*Interactive Brokers Rated Lowest Cost Broker by StockBrokers.com Annual Online Review 2020
Have feedback on this article? Concerned about the content? Get in touch with us directly. Alternatively, email editorial-team (at) simplywallst.com.
About SEHK:1959
Centenary United Holdings
Operates as an integrated auto service provider in the People’s Republic of China.
Adequate balance sheet with slight risk.
Market Insights

Advertisement
Community Narratives
The company that turned a verb into a global necessity and basically runs the modern internet, digital ads, smartphones, maps, and AI.
Fair Value US$300.00|7.1% undervalued
OS
Community Contributor
Flowers Foods Pays A Fair Price For Health
Fair Value US$16.12|26.4% undervalued
NV
Community Contributor
TMX Group will thrive with 33.3% profit margin and enduring market moat
Fair Value CA$49.90|0.8% overvalued
LI
Community Contributor
The "Molecular Pencil": Why Beam's Technology is Built to Win
Fair Value US$65.01|65.8% undervalued
DA
Community Contributor