
Advertisement
- Hong Kong
- /
- Specialty Stores
- /
- SEHK:1293
The Return Trends At Grand Baoxin Auto Group (HKG:1293) Look Promising
What are the early trends we should look for to identify a stock that could multiply in value over the long term? Firstly, we'll want to see a proven return on capital employed (ROCE) that is increasing, and secondly, an expanding base of capital employed. If you see this, it typically means it's a company with a great business model and plenty of profitable reinvestment opportunities. So when we looked at Grand Baoxin Auto Group (HKG:1293) and its trend of ROCE, we really liked what we saw.
Understanding Return On Capital Employed (ROCE)
Just to clarify if you're unsure, ROCE is a metric for evaluating how much pre-tax income (in percentage terms) a company earns on the capital invested in its business. Analysts use this formula to calculate it for Grand Baoxin Auto Group:
Return on Capital Employed = Earnings Before Interest and Tax (EBIT) ÷ (Total Assets - Current Liabilities)
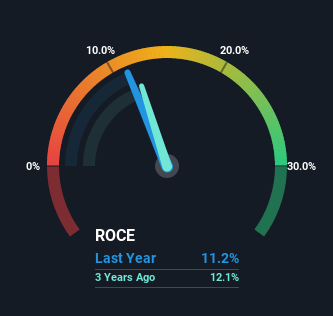
0.11 = CN¥1.5b ÷ (CN¥28b - CN¥14b) (Based on the trailing twelve months to December 2021).
Thus, Grand Baoxin Auto Group has an ROCE of 11%. That's a relatively normal return on capital, and it's around the 13% generated by the Specialty Retail industry.
Check out our latest analysis for Grand Baoxin Auto Group
In the above chart we have measured Grand Baoxin Auto Group's prior ROCE against its prior performance, but the future is arguably more important. If you'd like, you can check out the forecasts from the analysts covering Grand Baoxin Auto Group here for free.
What Does the ROCE Trend For Grand Baoxin Auto Group Tell Us?
We like the trends that we're seeing from Grand Baoxin Auto Group. Over the last five years, returns on capital employed have risen substantially to 11%. The amount of capital employed has increased too, by 25%. This can indicate that there's plenty of opportunities to invest capital internally and at ever higher rates, a combination that's common among multi-baggers.
On a separate but related note, it's important to know that Grand Baoxin Auto Group has a current liabilities to total assets ratio of 51%, which we'd consider pretty high. This effectively means that suppliers (or short-term creditors) are funding a large portion of the business, so just be aware that this can introduce some elements of risk. Ideally we'd like to see this reduce as that would mean fewer obligations bearing risks.
In Conclusion...
To sum it up, Grand Baoxin Auto Group has proven it can reinvest in the business and generate higher returns on that capital employed, which is terrific. And since the stock has dived 85% over the last five years, there may be other factors affecting the company's prospects. In any case, we believe the economic trends of this company are positive and looking into the stock further could prove rewarding.
Grand Baoxin Auto Group does come with some risks though, we found 2 warning signs in our investment analysis, and 1 of those shouldn't be ignored...
For those who like to invest in solid companies, check out this free list of companies with solid balance sheets and high returns on equity.
New: Manage All Your Stock Portfolios in One Place
We've created the ultimate portfolio companion for stock investors, and it's free.
• Connect an unlimited number of Portfolios and see your total in one currency
• Be alerted to new Warning Signs or Risks via email or mobile
• Track the Fair Value of your stocks
Have feedback on this article? Concerned about the content? Get in touch with us directly. Alternatively, email editorial-team (at) simplywallst.com.
This article by Simply Wall St is general in nature. We provide commentary based on historical data and analyst forecasts only using an unbiased methodology and our articles are not intended to be financial advice. It does not constitute a recommendation to buy or sell any stock, and does not take account of your objectives, or your financial situation. We aim to bring you long-term focused analysis driven by fundamental data. Note that our analysis may not factor in the latest price-sensitive company announcements or qualitative material. Simply Wall St has no position in any stocks mentioned.
About SEHK:1293
Grand Baoxin Auto Group
An investment holding company, engages in the sale and service of motor vehicles primarily in Mainland China.
Moderate and good value.
Market Insights

Advertisement
Community Narratives
MicroVision will explode future revenue by 380.37% with a vision towards success
Fair Value US$60.00|98.4% undervalued
TH
Community Contributor
The Indispensable Artery for a New North American Economy
Fair Value CA$132.87|1.3% undervalued
TI
Community Contributor