
Advertisement
- Hong Kong
- /
- Real Estate
- /
- SEHK:582
It's Down 32% But Shin Hwa World Limited (HKG:582) Could Be Riskier Than It Looks
Shin Hwa World Limited (HKG:582) shareholders that were waiting for something to happen have been dealt a blow with a 32% share price drop in the last month. The recent drop completes a disastrous twelve months for shareholders, who are sitting on a 66% loss during that time.
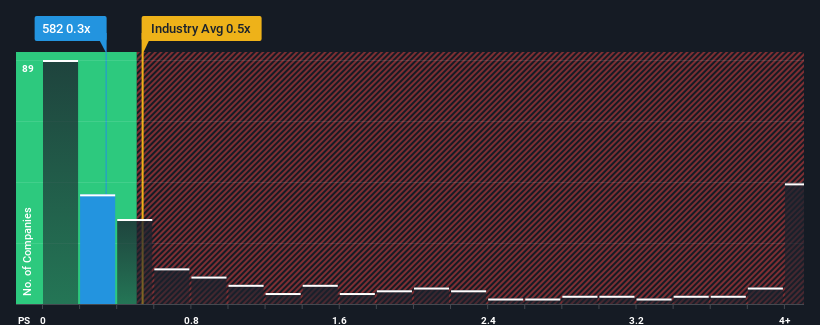
In spite of the heavy fall in price, it's still not a stretch to say that Shin Hwa World's price-to-sales (or "P/S") ratio of 0.3x right now seems quite "middle-of-the-road" compared to the Real Estate industry in Hong Kong, where the median P/S ratio is around 0.5x. However, investors might be overlooking a clear opportunity or potential setback if there is no rational basis for the P/S.
View our latest analysis for Shin Hwa World
How Shin Hwa World Has Been Performing
For instance, Shin Hwa World's receding revenue in recent times would have to be some food for thought. One possibility is that the P/S is moderate because investors think the company might still do enough to be in line with the broader industry in the near future. If you like the company, you'd at least be hoping this is the case so that you could potentially pick up some stock while it's not quite in favour.
Want the full picture on earnings, revenue and cash flow for the company? Then our free report on Shin Hwa World will help you shine a light on its historical performance.What Are Revenue Growth Metrics Telling Us About The P/S?
In order to justify its P/S ratio, Shin Hwa World would need to produce growth that's similar to the industry.
Taking a look back first, the company's revenue growth last year wasn't something to get excited about as it posted a disappointing decline of 25%. Even so, admirably revenue has lifted 32% in aggregate from three years ago, notwithstanding the last 12 months. Although it's been a bumpy ride, it's still fair to say the revenue growth recently has been more than adequate for the company.
This is in contrast to the rest of the industry, which is expected to grow by 3.2% over the next year, materially lower than the company's recent medium-term annualised growth rates.
In light of this, it's curious that Shin Hwa World's P/S sits in line with the majority of other companies. Apparently some shareholders believe the recent performance is at its limits and have been accepting lower selling prices.
What We Can Learn From Shin Hwa World's P/S?
With its share price dropping off a cliff, the P/S for Shin Hwa World looks to be in line with the rest of the Real Estate industry. It's argued the price-to-sales ratio is an inferior measure of value within certain industries, but it can be a powerful business sentiment indicator.
To our surprise, Shin Hwa World revealed its three-year revenue trends aren't contributing to its P/S as much as we would have predicted, given they look better than current industry expectations. There could be some unobserved threats to revenue preventing the P/S ratio from matching this positive performance. While recent revenue trends over the past medium-term suggest that the risk of a price decline is low, investors appear to see the likelihood of revenue fluctuations in the future.
There are also other vital risk factors to consider and we've discovered 3 warning signs for Shin Hwa World (2 are concerning!) that you should be aware of before investing here.
If these risks are making you reconsider your opinion on Shin Hwa World, explore our interactive list of high quality stocks to get an idea of what else is out there.
New: Manage All Your Stock Portfolios in One Place
We've created the ultimate portfolio companion for stock investors, and it's free.
• Connect an unlimited number of Portfolios and see your total in one currency
• Be alerted to new Warning Signs or Risks via email or mobile
• Track the Fair Value of your stocks
Have feedback on this article? Concerned about the content? Get in touch with us directly. Alternatively, email editorial-team (at) simplywallst.com.
This article by Simply Wall St is general in nature. We provide commentary based on historical data and analyst forecasts only using an unbiased methodology and our articles are not intended to be financial advice. It does not constitute a recommendation to buy or sell any stock, and does not take account of your objectives, or your financial situation. We aim to bring you long-term focused analysis driven by fundamental data. Note that our analysis may not factor in the latest price-sensitive company announcements or qualitative material. Simply Wall St has no position in any stocks mentioned.
About SEHK:582
Shin Hwa World
An investment holding company, engages in the integrated resort development, gaming, and property development businesses in South Korea.
Excellent balance sheet and slightly overvalued.
Market Insights

Advertisement
Community Narratives
The company that turned a verb into a global necessity and basically runs the modern internet, digital ads, smartphones, maps, and AI.
Fair Value US$300.00|7.5% undervalued
OS
Community Contributor
Flowers Foods Pays A Fair Price For Health
Fair Value US$16.12|25.4% undervalued
NV
Community Contributor
TMX Group will thrive with 33.3% profit margin and enduring market moat
Fair Value CA$49.90|3.6% overvalued
LI
Community Contributor
The "Molecular Pencil": Why Beam's Technology is Built to Win
Fair Value US$65.01|65.0% undervalued
DA
Community Contributor