- Hong Kong
- /
- Real Estate
- /
- SEHK:337
Greenland Hong Kong Holdings (HKG:337) investors are sitting on a loss of 84% if they invested three years ago


As an investor, mistakes are inevitable. But really big losses can really drag down an overall portfolio. So take a moment to sympathize with the long term shareholders of Greenland Hong Kong Holdings Limited (HKG:337), who have seen the share price tank a massive 89% over a three year period. That would certainly shake our confidence in the decision to own the stock. And over the last year the share price fell 65%, so we doubt many shareholders are delighted. The last week also saw the share price slip down another 10.0%. We really feel for shareholders in this scenario. It's a good reminder of the importance of diversification, and it's worth keeping in mind there's more to life than money, anyway.
Since shareholders are down over the longer term, lets look at the underlying fundamentals over the that time and see if they've been consistent with returns.
Check out our latest analysis for Greenland Hong Kong Holdings
While markets are a powerful pricing mechanism, share prices reflect investor sentiment, not just underlying business performance. One imperfect but simple way to consider how the market perception of a company has shifted is to compare the change in the earnings per share (EPS) with the share price movement.
During the three years that the share price fell, Greenland Hong Kong Holdings' earnings per share (EPS) dropped by 52% each year. So do you think it's a coincidence that the share price has dropped 52% per year, a very similar rate to the EPS? We don't. So it seems like sentiment towards the stock hasn't changed all that much over time. It seems like the share price is reflecting the declining earnings per share.
The company's earnings per share (over time) is depicted in the image below (click to see the exact numbers).
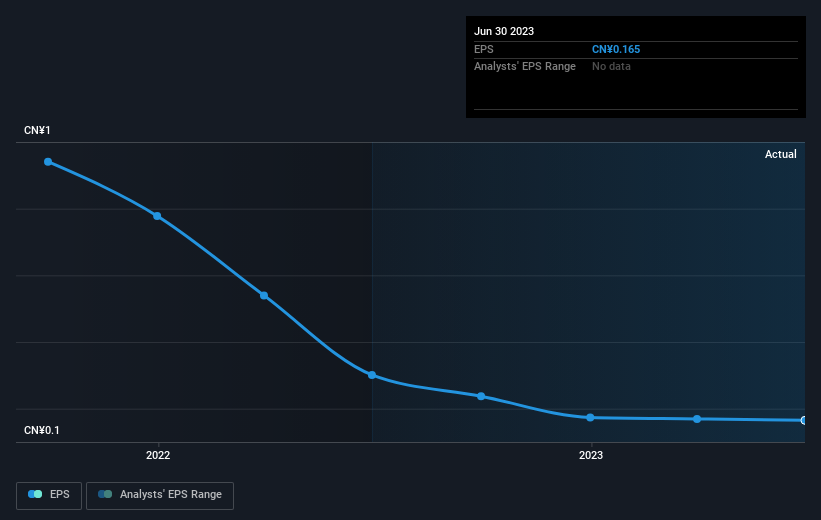
This free interactive report on Greenland Hong Kong Holdings' earnings, revenue and cash flow is a great place to start, if you want to investigate the stock further.
A Dividend Lost
The value of past dividends are accounted for in the total shareholder return (TSR), but not in the share price return mentioned above. By accounting for the value of dividends paid, the TSR can be seen as a more complete measure of the value a company brings to its shareholders. Greenland Hong Kong Holdings' TSR over the last 3 years is -84%; better than its share price return. Even though the company isn't paying dividends at the moment, it has done in the past.
A Different Perspective
We regret to report that Greenland Hong Kong Holdings shareholders are down 65% for the year. Unfortunately, that's worse than the broader market decline of 13%. Having said that, it's inevitable that some stocks will be oversold in a falling market. The key is to keep your eyes on the fundamental developments. Regrettably, last year's performance caps off a bad run, with the shareholders facing a total loss of 13% per year over five years. We realise that Baron Rothschild has said investors should "buy when there is blood on the streets", but we caution that investors should first be sure they are buying a high quality business. While it is well worth considering the different impacts that market conditions can have on the share price, there are other factors that are even more important. For instance, we've identified 5 warning signs for Greenland Hong Kong Holdings (2 can't be ignored) that you should be aware of.
If you would prefer to check out another company -- one with potentially superior financials -- then do not miss this free list of companies that have proven they can grow earnings.
Please note, the market returns quoted in this article reflect the market weighted average returns of stocks that currently trade on Hong Kong exchanges.
New: Manage All Your Stock Portfolios in One Place
We've created the ultimate portfolio companion for stock investors, and it's free.
• Connect an unlimited number of Portfolios and see your total in one currency
• Be alerted to new Warning Signs or Risks via email or mobile
• Track the Fair Value of your stocks
Have feedback on this article? Concerned about the content? Get in touch with us directly. Alternatively, email editorial-team (at) simplywallst.com.
This article by Simply Wall St is general in nature. We provide commentary based on historical data and analyst forecasts only using an unbiased methodology and our articles are not intended to be financial advice. It does not constitute a recommendation to buy or sell any stock, and does not take account of your objectives, or your financial situation. We aim to bring you long-term focused analysis driven by fundamental data. Note that our analysis may not factor in the latest price-sensitive company announcements or qualitative material. Simply Wall St has no position in any stocks mentioned.
About SEHK:337
Greenland Hong Kong Holdings
An investment holding company, engages in the property development, property and hotel investment, and property management businesses in the People’s Republic of China.
Slight with mediocre balance sheet.
