- Hong Kong
- /
- Real Estate
- /
- SEHK:2869
The three-year loss for Greentown Service Group (HKG:2869) shareholders likely driven by its shrinking earnings


Greentown Service Group Co. Ltd. (HKG:2869) shareholders should be happy to see the share price up 13% in the last month. But over the last three years we've seen a quite serious decline. In that time, the share price dropped 67%. So it is really good to see an improvement. The rise has some hopeful, but turnarounds are often precarious.
On a more encouraging note the company has added HK$443m to its market cap in just the last 7 days, so let's see if we can determine what's driven the three-year loss for shareholders.
View our latest analysis for Greentown Service Group
While the efficient markets hypothesis continues to be taught by some, it has been proven that markets are over-reactive dynamic systems, and investors are not always rational. One imperfect but simple way to consider how the market perception of a company has shifted is to compare the change in the earnings per share (EPS) with the share price movement.
Greentown Service Group saw its EPS decline at a compound rate of 3.4% per year, over the last three years. The share price decline of 31% is actually steeper than the EPS slippage. So it's likely that the EPS decline has disappointed the market, leaving investors hesitant to buy.
The image below shows how EPS has tracked over time (if you click on the image you can see greater detail).
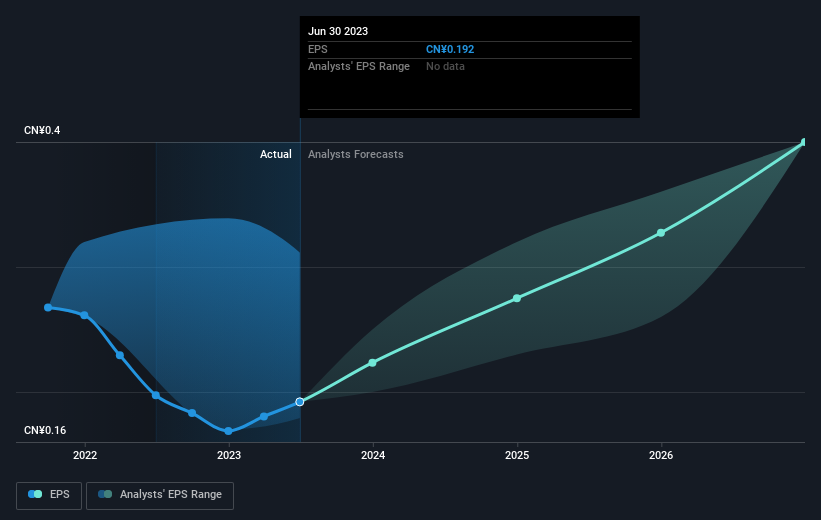
Dive deeper into Greentown Service Group's key metrics by checking this interactive graph of Greentown Service Group's earnings, revenue and cash flow.
What About Dividends?
As well as measuring the share price return, investors should also consider the total shareholder return (TSR). Whereas the share price return only reflects the change in the share price, the TSR includes the value of dividends (assuming they were reinvested) and the benefit of any discounted capital raising or spin-off. It's fair to say that the TSR gives a more complete picture for stocks that pay a dividend. We note that for Greentown Service Group the TSR over the last 3 years was -65%, which is better than the share price return mentioned above. The dividends paid by the company have thusly boosted the total shareholder return.
A Different Perspective
We regret to report that Greentown Service Group shareholders are down 40% for the year (even including dividends). Unfortunately, that's worse than the broader market decline of 6.6%. However, it could simply be that the share price has been impacted by broader market jitters. It might be worth keeping an eye on the fundamentals, in case there's a good opportunity. Unfortunately, last year's performance may indicate unresolved challenges, given that it was worse than the annualised loss of 9% over the last half decade. Generally speaking long term share price weakness can be a bad sign, though contrarian investors might want to research the stock in hope of a turnaround. While it is well worth considering the different impacts that market conditions can have on the share price, there are other factors that are even more important. For example, we've discovered 1 warning sign for Greentown Service Group that you should be aware of before investing here.
If you are like me, then you will not want to miss this free list of growing companies that insiders are buying.
Please note, the market returns quoted in this article reflect the market weighted average returns of stocks that currently trade on Hong Kong exchanges.
New: Manage All Your Stock Portfolios in One Place
We've created the ultimate portfolio companion for stock investors, and it's free.
• Connect an unlimited number of Portfolios and see your total in one currency
• Be alerted to new Warning Signs or Risks via email or mobile
• Track the Fair Value of your stocks
Have feedback on this article? Concerned about the content? Get in touch with us directly. Alternatively, email editorial-team (at) simplywallst.com.
This article by Simply Wall St is general in nature. We provide commentary based on historical data and analyst forecasts only using an unbiased methodology and our articles are not intended to be financial advice. It does not constitute a recommendation to buy or sell any stock, and does not take account of your objectives, or your financial situation. We aim to bring you long-term focused analysis driven by fundamental data. Note that our analysis may not factor in the latest price-sensitive company announcements or qualitative material. Simply Wall St has no position in any stocks mentioned.
About SEHK:2869
Greentown Service Group
Provides residential property management services in the People's Republic of China and internationally.
Flawless balance sheet with proven track record.

