- Hong Kong
- /
- Real Estate
- /
- SEHK:1240
CNQC International Holdings (HKG:1240 shareholders incur further losses as stock declines 14% this week, taking five-year losses to 83%


Long term investing is the way to go, but that doesn't mean you should hold every stock forever. We don't wish catastrophic capital loss on anyone. Spare a thought for those who held CNQC International Holdings Limited (HKG:1240) for five whole years - as the share price tanked 88%. And we doubt long term believers are the only worried holders, since the stock price has declined 58% over the last twelve months. Furthermore, it's down 26% in about a quarter. That's not much fun for holders. We really hope anyone holding through that price crash has a diversified portfolio. Even when you lose money, you don't have to lose the lesson.
If the past week is anything to go by, investor sentiment for CNQC International Holdings isn't positive, so let's see if there's a mismatch between fundamentals and the share price.
Check out our latest analysis for CNQC International Holdings
To paraphrase Benjamin Graham: Over the short term the market is a voting machine, but over the long term it's a weighing machine. By comparing earnings per share (EPS) and share price changes over time, we can get a feel for how investor attitudes to a company have morphed over time.
In the last half decade CNQC International Holdings saw its share price fall as its EPS declined below zero. Since the company has fallen to a loss making position, it's hard to compare the change in EPS with the share price change. However, we can say we'd expect to see a falling share price in this scenario.
You can see how EPS has changed over time in the image below (click on the chart to see the exact values).
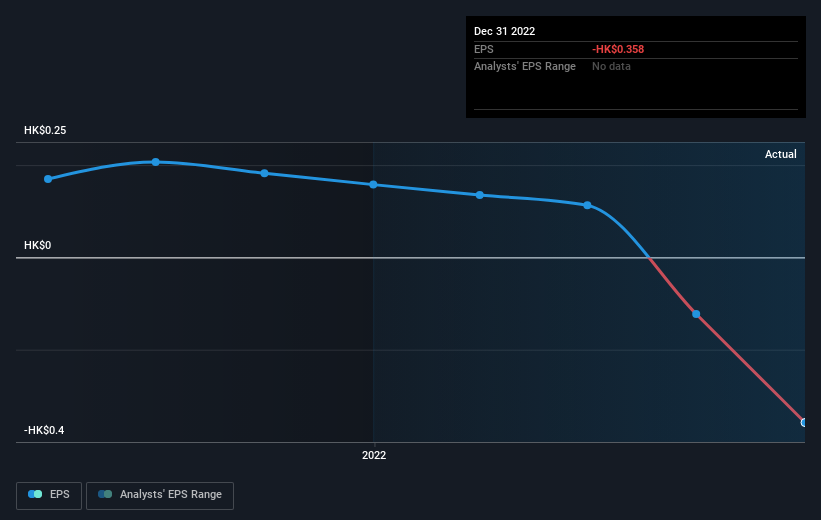
It might be well worthwhile taking a look at our free report on CNQC International Holdings' earnings, revenue and cash flow.
What About The Total Shareholder Return (TSR)?
We'd be remiss not to mention the difference between CNQC International Holdings' total shareholder return (TSR) and its share price return. The TSR is a return calculation that accounts for the value of cash dividends (assuming that any dividend received was reinvested) and the calculated value of any discounted capital raisings and spin-offs. Dividends have been really beneficial for CNQC International Holdings shareholders, and that cash payout explains why its total shareholder loss of 83%, over the last 5 years, isn't as bad as the share price return.
A Different Perspective
While the broader market lost about 1.0% in the twelve months, CNQC International Holdings shareholders did even worse, losing 58%. However, it could simply be that the share price has been impacted by broader market jitters. It might be worth keeping an eye on the fundamentals, in case there's a good opportunity. Regrettably, last year's performance caps off a bad run, with the shareholders facing a total loss of 13% per year over five years. Generally speaking long term share price weakness can be a bad sign, though contrarian investors might want to research the stock in hope of a turnaround. While it is well worth considering the different impacts that market conditions can have on the share price, there are other factors that are even more important. For example, we've discovered 3 warning signs for CNQC International Holdings (2 are concerning!) that you should be aware of before investing here.
If you would prefer to check out another company -- one with potentially superior financials -- then do not miss this free list of companies that have proven they can grow earnings.
Please note, the market returns quoted in this article reflect the market weighted average returns of stocks that currently trade on Hong Kong exchanges.
New: AI Stock Screener & Alerts
Our new AI Stock Screener scans the market every day to uncover opportunities.
• Dividend Powerhouses (3%+ Yield)
• Undervalued Small Caps with Insider Buying
• High growth Tech and AI Companies
Or build your own from over 50 metrics.
Have feedback on this article? Concerned about the content? Get in touch with us directly. Alternatively, email editorial-team (at) simplywallst.com.
This article by Simply Wall St is general in nature. We provide commentary based on historical data and analyst forecasts only using an unbiased methodology and our articles are not intended to be financial advice. It does not constitute a recommendation to buy or sell any stock, and does not take account of your objectives, or your financial situation. We aim to bring you long-term focused analysis driven by fundamental data. Note that our analysis may not factor in the latest price-sensitive company announcements or qualitative material. Simply Wall St has no position in any stocks mentioned.
About SEHK:1240
CNQC International Holdings
An investment holding company, operates as a property developer and contractor.
Slight and slightly overvalued.
