
Advertisement
Calculating The Intrinsic Value Of Beijing Tong Ren Tang Chinese Medicine Company Limited (HKG:3613)
Key Insights
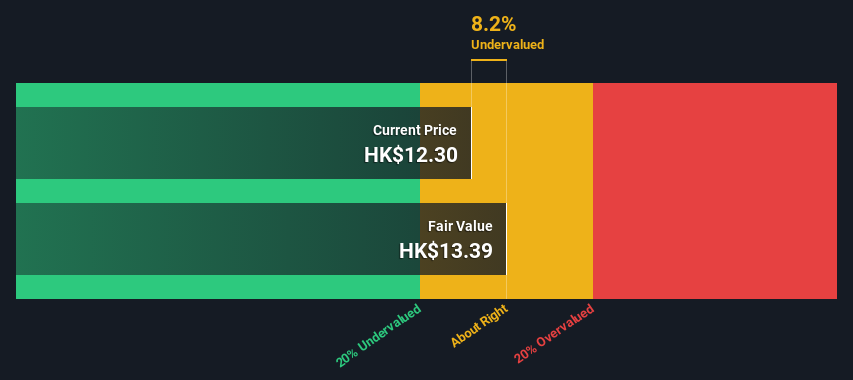
- Beijing Tong Ren Tang Chinese Medicine's estimated fair value is HK$13.39 based on 2 Stage Free Cash Flow to Equity
- Beijing Tong Ren Tang Chinese Medicine's HK$12.30 share price indicates it is trading at similar levels as its fair value estimate
- Our fair value estimate is 24% lower than Beijing Tong Ren Tang Chinese Medicine's analyst price target of HK$17.72
How far off is Beijing Tong Ren Tang Chinese Medicine Company Limited (HKG:3613) from its intrinsic value? Using the most recent financial data, we'll take a look at whether the stock is fairly priced by taking the forecast future cash flows of the company and discounting them back to today's value. We will use the Discounted Cash Flow (DCF) model on this occasion. It may sound complicated, but actually it is quite simple!
Companies can be valued in a lot of ways, so we would point out that a DCF is not perfect for every situation. For those who are keen learners of equity analysis, the Simply Wall St analysis model here may be something of interest to you.
Check out our latest analysis for Beijing Tong Ren Tang Chinese Medicine
The Calculation
We use what is known as a 2-stage model, which simply means we have two different periods of growth rates for the company's cash flows. Generally the first stage is higher growth, and the second stage is a lower growth phase. To start off with, we need to estimate the next ten years of cash flows. Seeing as no analyst estimates of free cash flow are available to us, we have extrapolate the previous free cash flow (FCF) from the company's last reported value. We assume companies with shrinking free cash flow will slow their rate of shrinkage, and that companies with growing free cash flow will see their growth rate slow, over this period. We do this to reflect that growth tends to slow more in the early years than it does in later years.
A DCF is all about the idea that a dollar in the future is less valuable than a dollar today, so we discount the value of these future cash flows to their estimated value in today's dollars:
10-year free cash flow (FCF) estimate
| 2024 | 2025 | 2026 | 2027 | 2028 | 2029 | 2030 | 2031 | 2032 | 2033 | |
| Levered FCF (HK$, Millions) | HK$629.4m | HK$603.1m | HK$589.0m | HK$582.8m | HK$582.0m | HK$584.9m | HK$590.3m | HK$597.7m | HK$606.4m | HK$616.2m |
| Growth Rate Estimate Source | Est @ -6.82% | Est @ -4.18% | Est @ -2.34% | Est @ -1.04% | Est @ -0.14% | Est @ 0.49% | Est @ 0.94% | Est @ 1.25% | Est @ 1.46% | Est @ 1.62% |
| Present Value (HK$, Millions) Discounted @ 6.7% | HK$590 | HK$530 | HK$485 | HK$450 | HK$421 | HK$396 | HK$375 | HK$356 | HK$338 | HK$322 |
("Est" = FCF growth rate estimated by Simply Wall St)
Present Value of 10-year Cash Flow (PVCF) = HK$4.3b
We now need to calculate the Terminal Value, which accounts for all the future cash flows after this ten year period. For a number of reasons a very conservative growth rate is used that cannot exceed that of a country's GDP growth. In this case we have used the 5-year average of the 10-year government bond yield (2.0%) to estimate future growth. In the same way as with the 10-year 'growth' period, we discount future cash flows to today's value, using a cost of equity of 6.7%.
Terminal Value (TV)= FCF2033 × (1 + g) ÷ (r – g) = HK$616m× (1 + 2.0%) ÷ (6.7%– 2.0%) = HK$13b
Present Value of Terminal Value (PVTV)= TV / (1 + r)10= HK$13b÷ ( 1 + 6.7%)10= HK$6.9b
The total value is the sum of cash flows for the next ten years plus the discounted terminal value, which results in the Total Equity Value, which in this case is HK$11b. The last step is to then divide the equity value by the number of shares outstanding. Relative to the current share price of HK$12.3, the company appears about fair value at a 8.2% discount to where the stock price trades currently. Remember though, that this is just an approximate valuation, and like any complex formula - garbage in, garbage out.
The Assumptions
Now the most important inputs to a discounted cash flow are the discount rate, and of course, the actual cash flows. You don't have to agree with these inputs, I recommend redoing the calculations yourself and playing with them. The DCF also does not consider the possible cyclicality of an industry, or a company's future capital requirements, so it does not give a full picture of a company's potential performance. Given that we are looking at Beijing Tong Ren Tang Chinese Medicine as potential shareholders, the cost of equity is used as the discount rate, rather than the cost of capital (or weighted average cost of capital, WACC) which accounts for debt. In this calculation we've used 6.7%, which is based on a levered beta of 0.800. Beta is a measure of a stock's volatility, compared to the market as a whole. We get our beta from the industry average beta of globally comparable companies, with an imposed limit between 0.8 and 2.0, which is a reasonable range for a stable business.
SWOT Analysis for Beijing Tong Ren Tang Chinese Medicine
Strength
- Earnings growth over the past year exceeded the industry.
- Debt is not viewed as a risk.
- Dividends are covered by earnings and cash flows.
Weakness
- Dividend is low compared to the top 25% of dividend payers in the Pharmaceuticals market.
Opportunity
- Annual revenue is forecast to grow faster than the Hong Kong market.
- Current share price is below our estimate of fair value.
Threat
- Annual earnings are forecast to grow slower than the Hong Kong market.
Next Steps:
Valuation is only one side of the coin in terms of building your investment thesis, and it shouldn't be the only metric you look at when researching a company. It's not possible to obtain a foolproof valuation with a DCF model. Instead the best use for a DCF model is to test certain assumptions and theories to see if they would lead to the company being undervalued or overvalued. For instance, if the terminal value growth rate is adjusted slightly, it can dramatically alter the overall result. For Beijing Tong Ren Tang Chinese Medicine, there are three fundamental items you should further examine:
- Financial Health: Does 3613 have a healthy balance sheet? Take a look at our free balance sheet analysis with six simple checks on key factors like leverage and risk.
- Future Earnings: How does 3613's growth rate compare to its peers and the wider market? Dig deeper into the analyst consensus number for the upcoming years by interacting with our free analyst growth expectation chart.
- Other High Quality Alternatives: Do you like a good all-rounder? Explore our interactive list of high quality stocks to get an idea of what else is out there you may be missing!
PS. Simply Wall St updates its DCF calculation for every Hong Kong stock every day, so if you want to find the intrinsic value of any other stock just search here.
Valuation is complex, but we're here to simplify it.
Discover if Beijing Tong Ren Tang Chinese Medicine might be undervalued or overvalued with our detailed analysis, featuring fair value estimates, potential risks, dividends, insider trades, and its financial condition.
Access Free AnalysisHave feedback on this article? Concerned about the content? Get in touch with us directly. Alternatively, email editorial-team (at) simplywallst.com.
This article by Simply Wall St is general in nature. We provide commentary based on historical data and analyst forecasts only using an unbiased methodology and our articles are not intended to be financial advice. It does not constitute a recommendation to buy or sell any stock, and does not take account of your objectives, or your financial situation. We aim to bring you long-term focused analysis driven by fundamental data. Note that our analysis may not factor in the latest price-sensitive company announcements or qualitative material. Simply Wall St has no position in any stocks mentioned.
About SEHK:3613
Beijing Tong Ren Tang Chinese Medicine
Engages in the manufacture, retail, and wholesale of healthcare products and Chinese medicine to wholesalers and individuals.
Flawless balance sheet established dividend payer.
Market Insights

Advertisement
Community Narratives
The company that turned a verb into a global necessity and basically runs the modern internet, digital ads, smartphones, maps, and AI.
Fair Value US$300.00|6.3% undervalued
OS
Community Contributor
Flowers Foods Pays A Fair Price For Health
Fair Value US$16.12|26.0% undervalued
NV
Community Contributor
TMX Group will thrive with 33.3% profit margin and enduring market moat
Fair Value CA$49.90|3.7% overvalued
LI
Community Contributor