China Shineway Pharmaceutical Group (HKG:2877) jumps 11% this week, though earnings growth is still tracking behind three-year shareholder returns


By buying an index fund, investors can approximate the average market return. But many of us dare to dream of bigger returns, and build a portfolio ourselves. Just take a look at China Shineway Pharmaceutical Group Limited (HKG:2877), which is up 51%, over three years, soundly beating the market decline of 41% (not including dividends). On the other hand, the returns haven't been quite so good recently, with shareholders up just 32% , including dividends .
Since it's been a strong week for China Shineway Pharmaceutical Group shareholders, let's have a look at trend of the longer term fundamentals.
See our latest analysis for China Shineway Pharmaceutical Group
While markets are a powerful pricing mechanism, share prices reflect investor sentiment, not just underlying business performance. One flawed but reasonable way to assess how sentiment around a company has changed is to compare the earnings per share (EPS) with the share price.
China Shineway Pharmaceutical Group was able to grow its EPS at 24% per year over three years, sending the share price higher. The average annual share price increase of 15% is actually lower than the EPS growth. So one could reasonably conclude that the market has cooled on the stock. We'd venture the lowish P/E ratio of 7.00 also reflects the negative sentiment around the stock.
You can see how EPS has changed over time in the image below (click on the chart to see the exact values).
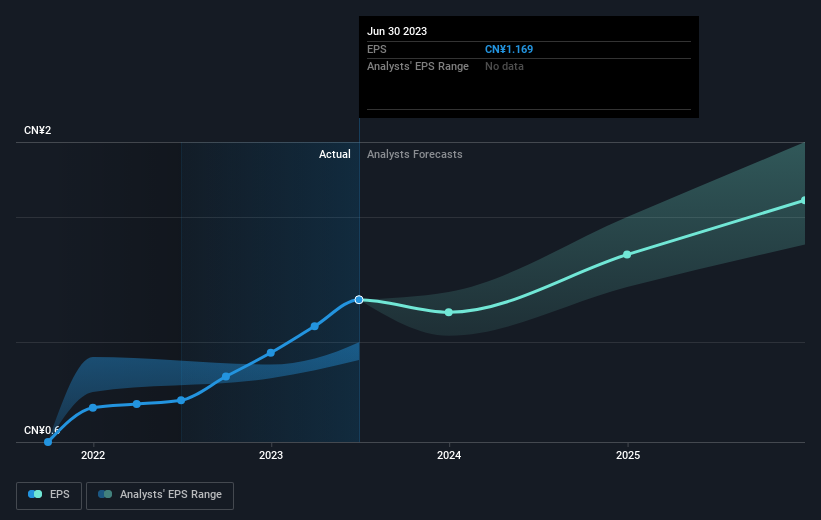
We know that China Shineway Pharmaceutical Group has improved its bottom line lately, but is it going to grow revenue? If you're interested, you could check this free report showing consensus revenue forecasts.
What About Dividends?
It is important to consider the total shareholder return, as well as the share price return, for any given stock. The TSR incorporates the value of any spin-offs or discounted capital raisings, along with any dividends, based on the assumption that the dividends are reinvested. It's fair to say that the TSR gives a more complete picture for stocks that pay a dividend. We note that for China Shineway Pharmaceutical Group the TSR over the last 3 years was 85%, which is better than the share price return mentioned above. And there's no prize for guessing that the dividend payments largely explain the divergence!
A Different Perspective
We're pleased to report that China Shineway Pharmaceutical Group shareholders have received a total shareholder return of 32% over one year. Of course, that includes the dividend. That gain is better than the annual TSR over five years, which is 8%. Therefore it seems like sentiment around the company has been positive lately. In the best case scenario, this may hint at some real business momentum, implying that now could be a great time to delve deeper. While it is well worth considering the different impacts that market conditions can have on the share price, there are other factors that are even more important. To that end, you should be aware of the 1 warning sign we've spotted with China Shineway Pharmaceutical Group .
If you would prefer to check out another company -- one with potentially superior financials -- then do not miss this free list of companies that have proven they can grow earnings.
Please note, the market returns quoted in this article reflect the market weighted average returns of stocks that currently trade on Hong Kong exchanges.
New: AI Stock Screener & Alerts
Our new AI Stock Screener scans the market every day to uncover opportunities.
• Dividend Powerhouses (3%+ Yield)
• Undervalued Small Caps with Insider Buying
• High growth Tech and AI Companies
Or build your own from over 50 metrics.
Have feedback on this article? Concerned about the content? Get in touch with us directly. Alternatively, email editorial-team (at) simplywallst.com.
This article by Simply Wall St is general in nature. We provide commentary based on historical data and analyst forecasts only using an unbiased methodology and our articles are not intended to be financial advice. It does not constitute a recommendation to buy or sell any stock, and does not take account of your objectives, or your financial situation. We aim to bring you long-term focused analysis driven by fundamental data. Note that our analysis may not factor in the latest price-sensitive company announcements or qualitative material. Simply Wall St has no position in any stocks mentioned.
About SEHK:2877
China Shineway Pharmaceutical Group
An investment holding company, engages in the research and development, manufacture, and trade of Chinese medicines in the People’s Republic of China and Hong Kong.
Undervalued with solid track record and pays a dividend.
