The 78% return delivered to Pak Fah Yeow International's (HKG:239) shareholders actually lagged YoY earnings growth


These days it's easy to simply buy an index fund, and your returns should (roughly) match the market. But one can do better than that by picking better than average stocks (as part of a diversified portfolio). To wit, the Pak Fah Yeow International Limited (HKG:239) share price is 63% higher than it was a year ago, much better than the market decline of around 14% (not including dividends) in the same period. If it can keep that out-performance up over the long term, investors will do very well! Having said that, the longer term returns aren't so impressive, with stock gaining just 9.9% in three years.
The past week has proven to be lucrative for Pak Fah Yeow International investors, so let's see if fundamentals drove the company's one-year performance.
See our latest analysis for Pak Fah Yeow International
While markets are a powerful pricing mechanism, share prices reflect investor sentiment, not just underlying business performance. One flawed but reasonable way to assess how sentiment around a company has changed is to compare the earnings per share (EPS) with the share price.
During the last year Pak Fah Yeow International grew its earnings per share (EPS) by 243%. This EPS growth is significantly higher than the 63% increase in the share price. So it seems like the market has cooled on Pak Fah Yeow International, despite the growth. Interesting. The caution is also evident in the lowish P/E ratio of 7.07.
The image below shows how EPS has tracked over time (if you click on the image you can see greater detail).
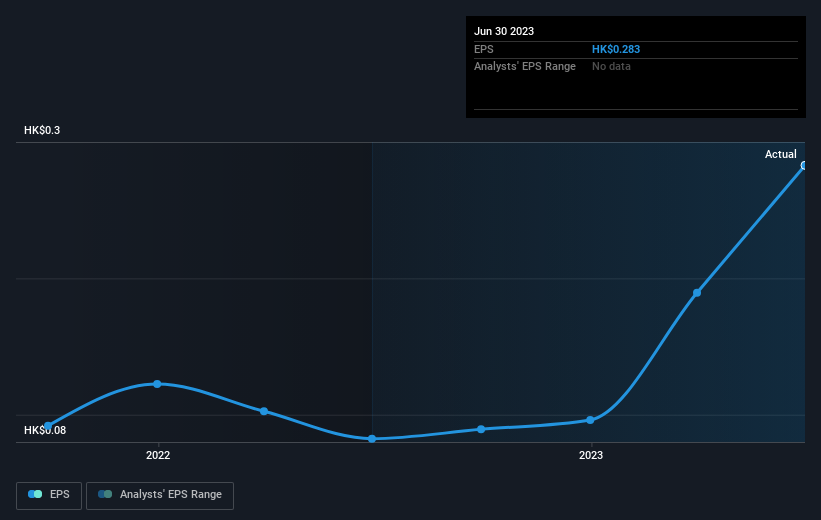
It might be well worthwhile taking a look at our free report on Pak Fah Yeow International's earnings, revenue and cash flow.
What About Dividends?
When looking at investment returns, it is important to consider the difference between total shareholder return (TSR) and share price return. The TSR incorporates the value of any spin-offs or discounted capital raisings, along with any dividends, based on the assumption that the dividends are reinvested. Arguably, the TSR gives a more comprehensive picture of the return generated by a stock. In the case of Pak Fah Yeow International, it has a TSR of 78% for the last 1 year. That exceeds its share price return that we previously mentioned. This is largely a result of its dividend payments!
A Different Perspective
We're pleased to report that Pak Fah Yeow International shareholders have received a total shareholder return of 78% over one year. And that does include the dividend. That certainly beats the loss of about 3% per year over the last half decade. We generally put more weight on the long term performance over the short term, but the recent improvement could hint at a (positive) inflection point within the business. I find it very interesting to look at share price over the long term as a proxy for business performance. But to truly gain insight, we need to consider other information, too. Even so, be aware that Pak Fah Yeow International is showing 2 warning signs in our investment analysis , you should know about...
But note: Pak Fah Yeow International may not be the best stock to buy. So take a peek at this free list of interesting companies with past earnings growth (and further growth forecast).
Please note, the market returns quoted in this article reflect the market weighted average returns of stocks that currently trade on Hong Kong exchanges.
New: Manage All Your Stock Portfolios in One Place
We've created the ultimate portfolio companion for stock investors, and it's free.
• Connect an unlimited number of Portfolios and see your total in one currency
• Be alerted to new Warning Signs or Risks via email or mobile
• Track the Fair Value of your stocks
Have feedback on this article? Concerned about the content? Get in touch with us directly. Alternatively, email editorial-team (at) simplywallst.com.
This article by Simply Wall St is general in nature. We provide commentary based on historical data and analyst forecasts only using an unbiased methodology and our articles are not intended to be financial advice. It does not constitute a recommendation to buy or sell any stock, and does not take account of your objectives, or your financial situation. We aim to bring you long-term focused analysis driven by fundamental data. Note that our analysis may not factor in the latest price-sensitive company announcements or qualitative material. Simply Wall St has no position in any stocks mentioned.
About SEHK:239
Pak Fah Yeow International
An investment holding, engages in manufacturing, marketing, and distributing healthcare products under the Hoe Hin brand name.
Flawless balance sheet with solid track record and pays a dividend.
