Advertisement
Innovent Biologics (SEHK:1801) Valuation in Focus After Promising Early Data for Novel Hypertension RNAi Therapy

Simply Wall St
Reviewed by Simply Wall St
Innovent Biologics (SEHK:1801) is in focus after presenting early results from its first-in-human Phase 1 trial of IBI3016, a new RNA interference treatment for hypertension, at the American Heart Association scientific sessions.
See our latest analysis for Innovent Biologics.
Strong early data from Innovent’s novel RNAi hypertension treatment has certainly kept the spotlight on the stock, especially after a string of robust product launches and revenue growth. While the share price return dipped slightly this past quarter, investors have enjoyed a remarkable 145% gain year-to-date and an impressive 134.6% total shareholder return over the past year, signaling momentum is far from fading.
Want to uncover more promising healthcare names with expanding pipelines? Use our curated screener to discover other innovators: See the full list for free.
But with the shares already up triple digits this year and strong revenue growth now routine, is Innovent Biologics still trading below its true value? Or has the market already priced in the company's next leap forward?
Price-to-Earnings of 120.8x: Is it justified?
Innovent Biologics currently trades at a price-to-earnings (P/E) ratio of 120.8 times, well above both the industry average and its own fair P/E benchmark. This signals the stock commands a significant valuation premium compared to its peers despite its recent profitability surge and rapid growth expectations.
The price-to-earnings ratio measures what investors are willing to pay for each dollar of earnings. In biotech, a high P/E can sometimes reflect lofty growth hopes, recent milestones, or anticipation of future breakthroughs. In Innovent's case, this premium could be due to market anticipation for commercial success and pipeline momentum.
Compared to the Asian Biotechs industry average of 41.9x, Innovent’s multiple looks steep. The estimated fair P/E ratio for the company is 33.6x. This suggests the current price embeds high expectations that the company will significantly outperform. The market could adjust closer to this fair level if company results miss expectations or sector sentiment changes.
Explore the SWS fair ratio for Innovent Biologics
Result: Price-to-Earnings of 120.8x (OVERVALUED)
However, rapid share price gains and a lofty valuation mean that any misstep in earnings or slower revenue growth could quickly dampen investor enthusiasm.
Find out about the key risks to this Innovent Biologics narrative.
Another View: Discounted Cash Flow Tells a Different Story
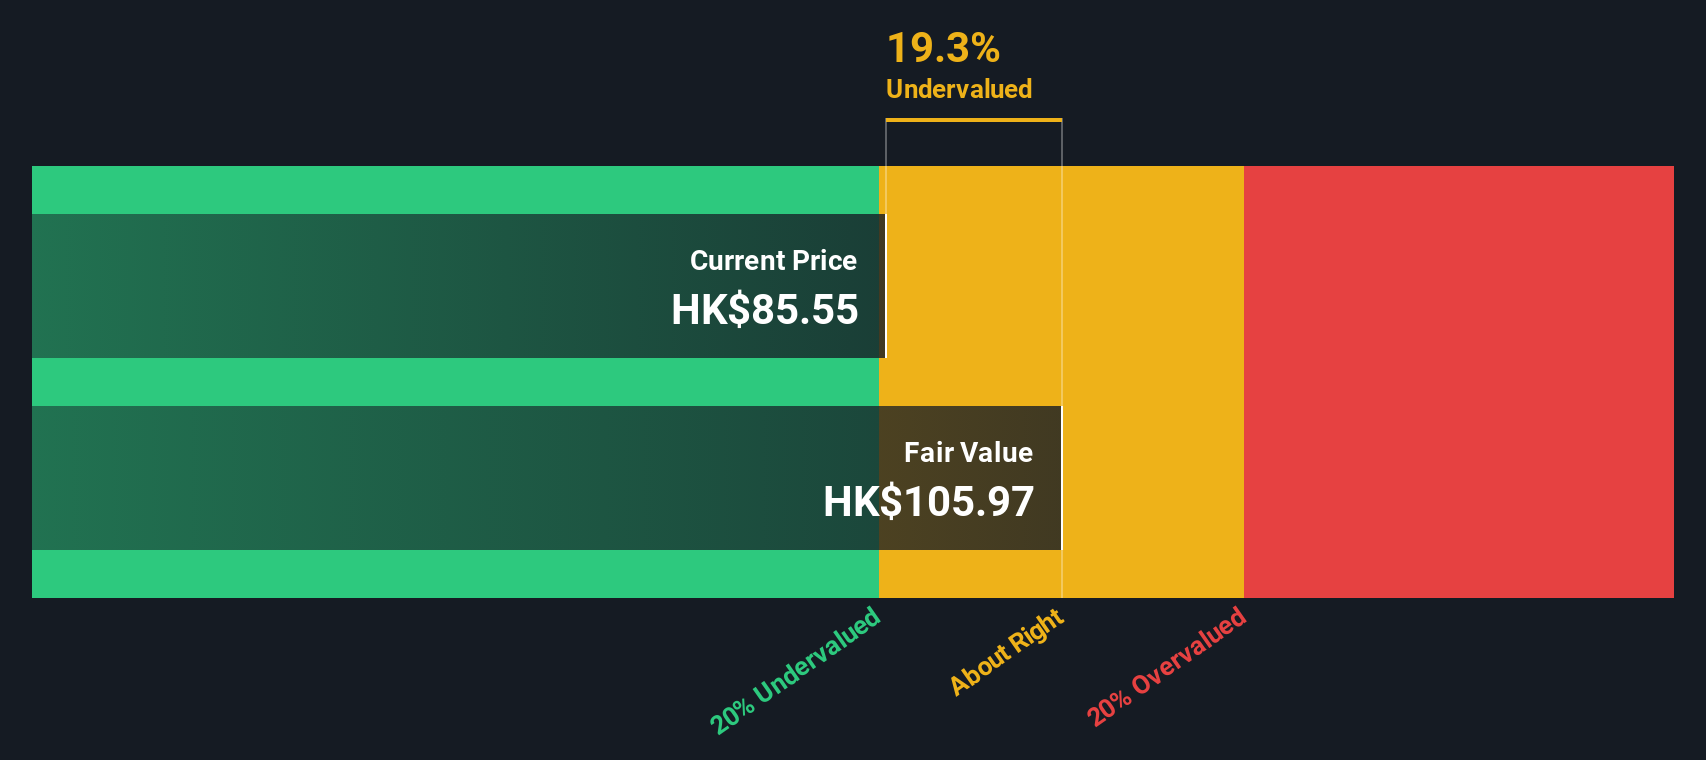
While the P/E ratio paints Innovent as richly valued, our SWS DCF model suggests the stock is actually trading about 18% below its fair value estimate (HK$87.15 versus HK$106.75). This approach gives more weight to future cash flows compared to market hype. Which view will prove right as the story unfolds?
Look into how the SWS DCF model arrives at its fair value.
Simply Wall St performs a discounted cash flow (DCF) on every stock in the world every day (check out Innovent Biologics for example). We show the entire calculation in full. You can track the result in your watchlist or portfolio and be alerted when this changes, or use our stock screener to discover 858 undervalued stocks based on their cash flows. If you save a screener we even alert you when new companies match - so you never miss a potential opportunity.
Build Your Own Innovent Biologics Narrative
If you’d rather dig into the data yourself or see the story from a different angle, you can craft your own take in just a few minutes. Do it your way.
A good starting point is our analysis highlighting 4 key rewards investors are optimistic about regarding Innovent Biologics.
Looking for more investment ideas?
Stay one step ahead by uncovering hand-picked investments designed for every strategy, from cutting-edge tech to reliable income and beyond with our expert Screeners.
- Spot hidden gems with potential for big gains. See which ones boast strong fundamentals among these 3571 penny stocks with strong financials.
- Capture tomorrow’s innovation and move ahead of trends by checking out the latest breakthroughs powering these 25 AI penny stocks.
- Position yourself for steady, long-term returns by targeting reliable income streams in these 15 dividend stocks with yields > 3%.
This article by Simply Wall St is general in nature. We provide commentary based on historical data and analyst forecasts only using an unbiased methodology and our articles are not intended to be financial advice. It does not constitute a recommendation to buy or sell any stock, and does not take account of your objectives, or your financial situation. We aim to bring you long-term focused analysis driven by fundamental data. Note that our analysis may not factor in the latest price-sensitive company announcements or qualitative material. Simply Wall St has no position in any stocks mentioned.
New: AI Stock Screener & Alerts
Our new AI Stock Screener scans the market every day to uncover opportunities.
• Dividend Powerhouses (3%+ Yield)
• Undervalued Small Caps with Insider Buying
• High growth Tech and AI Companies
Or build your own from over 50 metrics.
Have feedback on this article? Concerned about the content? Get in touch with us directly. Alternatively, email editorial-team@simplywallst.com
About SEHK:1801
Innovent Biologics
A biopharmaceutical company, engages in the research and development of antibody and protein medicine products in the People’s Republic of China, the United States, and internationally.
High growth potential with excellent balance sheet.
Similar Companies
Market Insights

Advertisement
Community Narratives
The "Molecular Pencil": Why Beam's Technology is Built to Win
Fair Value US$65.01|65.4% undervalued
DA
Community Contributor
The silent giant behind virtually every advanced chip powering AI, smartphones, and modern infrastructure.
Fair Value US$310.00|6.1% undervalued
OS
Community Contributor
ADP Stock: Solid Fundamentals, But AI Investments Test Its Margin Resilience
Fair Value US$387.77|34.2% undervalued
YI
Community Contributor
MINISO's fair value is projected at 26.69 with an anticipated PE ratio shift of 20x
Fair Value US$24.03|9.6% undervalued
BE
Community Contributor