- Hong Kong
- /
- Metals and Mining
- /
- SEHK:639
Shougang Fushan Resources Group's (HKG:639) five-year earnings growth trails the impressive shareholder returns


When we invest, we're generally looking for stocks that outperform the market average. And while active stock picking involves risks (and requires diversification) it can also provide excess returns. To wit, the Shougang Fushan Resources Group share price has climbed 89% in five years, easily topping the market decline of 25% (ignoring dividends). However, more recent returns haven't been as impressive as that, with the stock returning just 46% in the last year , including dividends .
On the back of a solid 7-day performance, let's check what role the company's fundamentals have played in driving long term shareholder returns.
View our latest analysis for Shougang Fushan Resources Group
To paraphrase Benjamin Graham: Over the short term the market is a voting machine, but over the long term it's a weighing machine. One imperfect but simple way to consider how the market perception of a company has shifted is to compare the change in the earnings per share (EPS) with the share price movement.
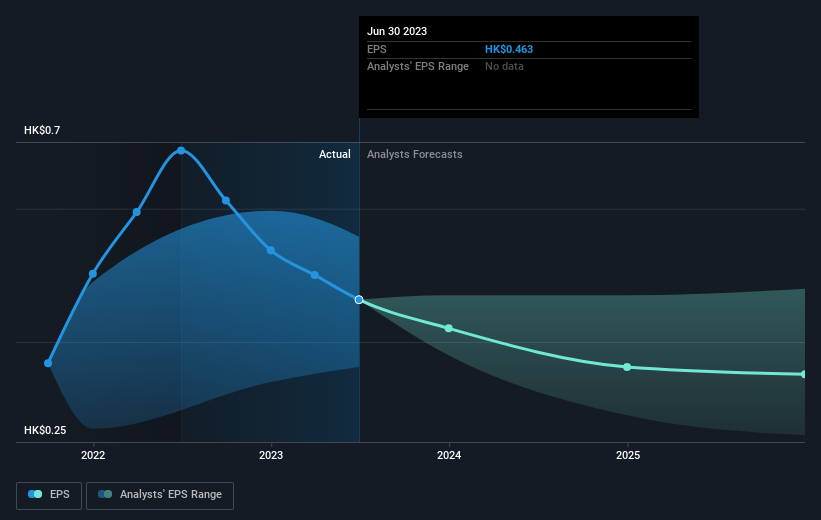
Over half a decade, Shougang Fushan Resources Group managed to grow its earnings per share at 19% a year. This EPS growth is higher than the 14% average annual increase in the share price. So it seems the market isn't so enthusiastic about the stock these days. The reasonably low P/E ratio of 7.07 also suggests market apprehension.
The graphic below depicts how EPS has changed over time (unveil the exact values by clicking on the image).
It is of course excellent to see how Shougang Fushan Resources Group has grown profits over the years, but the future is more important for shareholders. Take a more thorough look at Shougang Fushan Resources Group's financial health with this free report on its balance sheet.
What About Dividends?
It is important to consider the total shareholder return, as well as the share price return, for any given stock. The TSR is a return calculation that accounts for the value of cash dividends (assuming that any dividend received was reinvested) and the calculated value of any discounted capital raisings and spin-offs. So for companies that pay a generous dividend, the TSR is often a lot higher than the share price return. As it happens, Shougang Fushan Resources Group's TSR for the last 5 years was 243%, which exceeds the share price return mentioned earlier. This is largely a result of its dividend payments!
A Different Perspective
We're pleased to report that Shougang Fushan Resources Group shareholders have received a total shareholder return of 46% over one year. Of course, that includes the dividend. That gain is better than the annual TSR over five years, which is 28%. Therefore it seems like sentiment around the company has been positive lately. Someone with an optimistic perspective could view the recent improvement in TSR as indicating that the business itself is getting better with time. It's always interesting to track share price performance over the longer term. But to understand Shougang Fushan Resources Group better, we need to consider many other factors. For instance, we've identified 2 warning signs for Shougang Fushan Resources Group (1 is potentially serious) that you should be aware of.
But note: Shougang Fushan Resources Group may not be the best stock to buy. So take a peek at this free list of interesting companies with past earnings growth (and further growth forecast).
Please note, the market returns quoted in this article reflect the market weighted average returns of stocks that currently trade on Hong Kong exchanges.
New: Manage All Your Stock Portfolios in One Place
We've created the ultimate portfolio companion for stock investors, and it's free.
• Connect an unlimited number of Portfolios and see your total in one currency
• Be alerted to new Warning Signs or Risks via email or mobile
• Track the Fair Value of your stocks
Have feedback on this article? Concerned about the content? Get in touch with us directly. Alternatively, email editorial-team (at) simplywallst.com.
This article by Simply Wall St is general in nature. We provide commentary based on historical data and analyst forecasts only using an unbiased methodology and our articles are not intended to be financial advice. It does not constitute a recommendation to buy or sell any stock, and does not take account of your objectives, or your financial situation. We aim to bring you long-term focused analysis driven by fundamental data. Note that our analysis may not factor in the latest price-sensitive company announcements or qualitative material. Simply Wall St has no position in any stocks mentioned.
About SEHK:639
Shougang Fushan Resources Group
An investment holding company, engages in the business of raw coal mining and processing, and sales of raw and clean coal in the People's Republic of China.
Flawless balance sheet established dividend payer.
