
Advertisement
- Hong Kong
- /
- Metals and Mining
- /
- SEHK:639
Shougang Fushan Resources Group Limited's (HKG:639) Intrinsic Value Is Potentially 71% Above Its Share Price
Key Insights
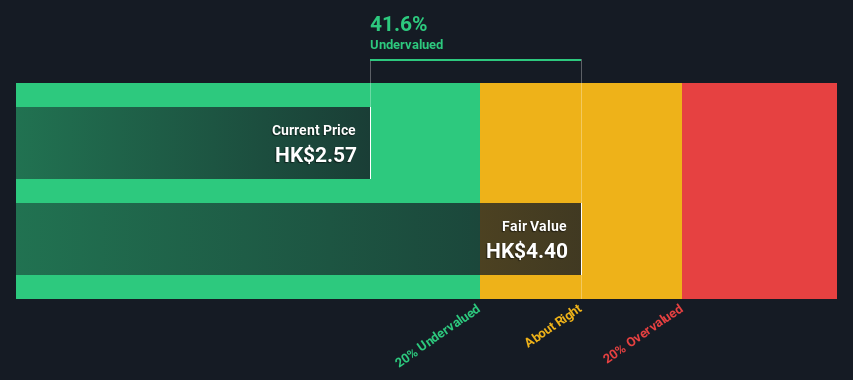
- Using the 2 Stage Free Cash Flow to Equity, Shougang Fushan Resources Group fair value estimate is HK$4.40
- Shougang Fushan Resources Group is estimated to be 42% undervalued based on current share price of HK$2.57
- Analyst price target for 639 is HK$3.16 which is 28% below our fair value estimate
In this article we are going to estimate the intrinsic value of Shougang Fushan Resources Group Limited (HKG:639) by estimating the company's future cash flows and discounting them to their present value. One way to achieve this is by employing the Discounted Cash Flow (DCF) model. Before you think you won't be able to understand it, just read on! It's actually much less complex than you'd imagine.
We generally believe that a company's value is the present value of all of the cash it will generate in the future. However, a DCF is just one valuation metric among many, and it is not without flaws. Anyone interested in learning a bit more about intrinsic value should have a read of the Simply Wall St analysis model.
See our latest analysis for Shougang Fushan Resources Group
The Calculation
We are going to use a two-stage DCF model, which, as the name states, takes into account two stages of growth. The first stage is generally a higher growth period which levels off heading towards the terminal value, captured in the second 'steady growth' period. To start off with, we need to estimate the next ten years of cash flows. Where possible we use analyst estimates, but when these aren't available we extrapolate the previous free cash flow (FCF) from the last estimate or reported value. We assume companies with shrinking free cash flow will slow their rate of shrinkage, and that companies with growing free cash flow will see their growth rate slow, over this period. We do this to reflect that growth tends to slow more in the early years than it does in later years.
Generally we assume that a dollar today is more valuable than a dollar in the future, so we discount the value of these future cash flows to their estimated value in today's dollars:
10-year free cash flow (FCF) estimate
| 2024 | 2025 | 2026 | 2027 | 2028 | 2029 | 2030 | 2031 | 2032 | 2033 | |
| Levered FCF (HK$, Millions) | HK$2.40b | HK$1.95b | HK$1.70b | HK$1.56b | HK$1.48b | HK$1.43b | HK$1.41b | HK$1.40b | HK$1.41b | HK$1.42b |
| Growth Rate Estimate Source | Analyst x1 | Analyst x1 | Est @ -12.74% | Est @ -8.33% | Est @ -5.24% | Est @ -3.08% | Est @ -1.56% | Est @ -0.50% | Est @ 0.24% | Est @ 0.76% |
| Present Value (HK$, Millions) Discounted @ 8.2% | HK$2.2k | HK$1.7k | HK$1.3k | HK$1.1k | HK$997 | HK$893 | HK$812 | HK$747 | HK$692 | HK$644 |
("Est" = FCF growth rate estimated by Simply Wall St)
Present Value of 10-year Cash Flow (PVCF) = HK$11b
We now need to calculate the Terminal Value, which accounts for all the future cash flows after this ten year period. For a number of reasons a very conservative growth rate is used that cannot exceed that of a country's GDP growth. In this case we have used the 5-year average of the 10-year government bond yield (2.0%) to estimate future growth. In the same way as with the 10-year 'growth' period, we discount future cash flows to today's value, using a cost of equity of 8.2%.
Terminal Value (TV)= FCF2033 × (1 + g) ÷ (r – g) = HK$1.4b× (1 + 2.0%) ÷ (8.2%– 2.0%) = HK$23b
Present Value of Terminal Value (PVTV)= TV / (1 + r)10= HK$23b÷ ( 1 + 8.2%)10= HK$11b
The total value, or equity value, is then the sum of the present value of the future cash flows, which in this case is HK$22b. In the final step we divide the equity value by the number of shares outstanding. Relative to the current share price of HK$2.6, the company appears quite undervalued at a 42% discount to where the stock price trades currently. Valuations are imprecise instruments though, rather like a telescope - move a few degrees and end up in a different galaxy. Do keep this in mind.
The Assumptions
The calculation above is very dependent on two assumptions. The first is the discount rate and the other is the cash flows. If you don't agree with these result, have a go at the calculation yourself and play with the assumptions. The DCF also does not consider the possible cyclicality of an industry, or a company's future capital requirements, so it does not give a full picture of a company's potential performance. Given that we are looking at Shougang Fushan Resources Group as potential shareholders, the cost of equity is used as the discount rate, rather than the cost of capital (or weighted average cost of capital, WACC) which accounts for debt. In this calculation we've used 8.2%, which is based on a levered beta of 1.055. Beta is a measure of a stock's volatility, compared to the market as a whole. We get our beta from the industry average beta of globally comparable companies, with an imposed limit between 0.8 and 2.0, which is a reasonable range for a stable business.
SWOT Analysis for Shougang Fushan Resources Group
Strength
- Currently debt free.
- Dividends are covered by earnings and cash flows.
- Dividend is in the top 25% of dividend payers in the market.
Weakness
- Earnings declined over the past year.
Opportunity
- Trading below our estimate of fair value by more than 20%.
Threat
- Annual earnings are forecast to decline for the next 3 years.
Looking Ahead:
Whilst important, the DCF calculation is only one of many factors that you need to assess for a company. DCF models are not the be-all and end-all of investment valuation. Preferably you'd apply different cases and assumptions and see how they would impact the company's valuation. If a company grows at a different rate, or if its cost of equity or risk free rate changes sharply, the output can look very different. What is the reason for the share price sitting below the intrinsic value? For Shougang Fushan Resources Group, we've put together three essential elements you should further research:
- Risks: Be aware that Shougang Fushan Resources Group is showing 2 warning signs in our investment analysis , and 1 of those is a bit concerning...
- Future Earnings: How does 639's growth rate compare to its peers and the wider market? Dig deeper into the analyst consensus number for the upcoming years by interacting with our free analyst growth expectation chart.
- Other High Quality Alternatives: Do you like a good all-rounder? Explore our interactive list of high quality stocks to get an idea of what else is out there you may be missing!
PS. The Simply Wall St app conducts a discounted cash flow valuation for every stock on the SEHK every day. If you want to find the calculation for other stocks just search here.
New: Manage All Your Stock Portfolios in One Place
We've created the ultimate portfolio companion for stock investors, and it's free.
• Connect an unlimited number of Portfolios and see your total in one currency
• Be alerted to new Warning Signs or Risks via email or mobile
• Track the Fair Value of your stocks
Have feedback on this article? Concerned about the content? Get in touch with us directly. Alternatively, email editorial-team (at) simplywallst.com.
This article by Simply Wall St is general in nature. We provide commentary based on historical data and analyst forecasts only using an unbiased methodology and our articles are not intended to be financial advice. It does not constitute a recommendation to buy or sell any stock, and does not take account of your objectives, or your financial situation. We aim to bring you long-term focused analysis driven by fundamental data. Note that our analysis may not factor in the latest price-sensitive company announcements or qualitative material. Simply Wall St has no position in any stocks mentioned.
About SEHK:639
Shougang Fushan Resources Group
An investment holding company, engages in the business of coking coal mining and production and sales of coking coal products in the People's Republic of China.
Flawless balance sheet and good value.
Similar Companies
Market Insights

Advertisement
Community Narratives
MicroVision will explode future revenue by 380.37% with a vision towards success
Fair Value US$60.00|98.4% undervalued
TH
Community Contributor
The Indispensable Artery for a New North American Economy
Fair Value CA$132.87|1.3% undervalued
TI
Community Contributor