
Advertisement
- Hong Kong
- /
- Metals and Mining
- /
- SEHK:581
What Kind Of Shareholders Own China Oriental Group Company Limited (HKG:581)?

The big shareholder groups in China Oriental Group Company Limited (HKG:581) have power over the company. Insiders often own a large chunk of younger, smaller, companies while huge companies tend to have institutions as shareholders. We also tend to see lower insider ownership in companies that were previously publicly owned.
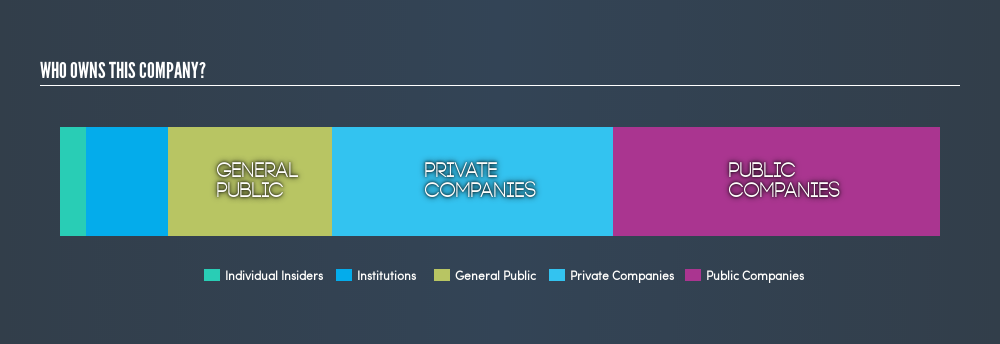
With a market capitalization of HK$19b, China Oriental Group is a decent size, so it is probably on the radar of institutional investors. In the chart below below, we can see that institutions are noticeable on the share registry. Let's take a closer look to see what the different types of shareholder can tell us about 581.
See our latest analysis for China Oriental Group
What Does The Institutional Ownership Tell Us About China Oriental Group?
Institutional investors commonly compare their own returns to the returns of a commonly followed index. So they generally do consider buying larger companies that are included in the relevant benchmark index.
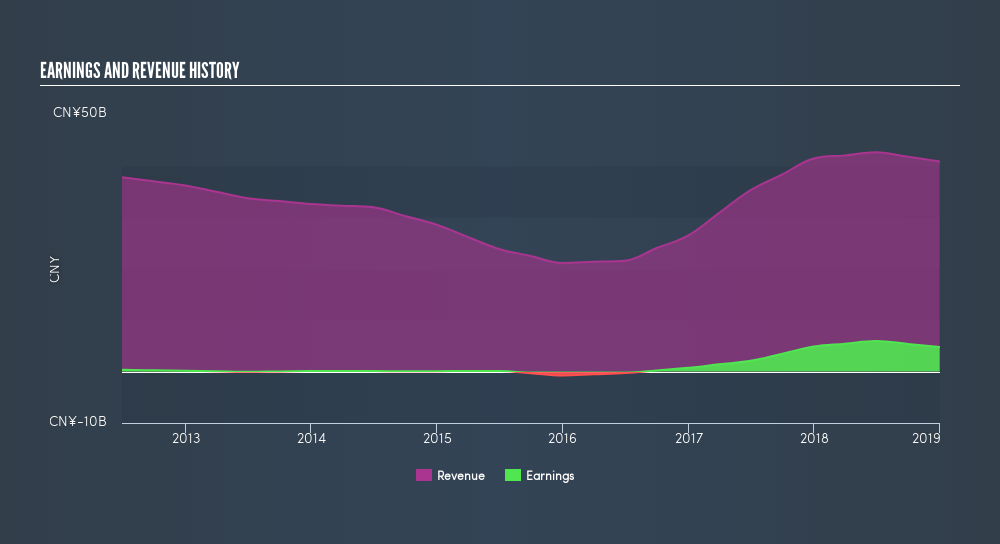
We can see that China Oriental Group does have institutional investors; and they hold 9.4% of the stock. This suggests some credibility amongst professional investors. But we can't rely on that fact alone, since institutions make bad investments sometimes, just like everyone does. If multiple institutions change their view on a stock at the same time, you could see the share price drop fast. It's therefore worth looking at China Oriental Group's earnings history, below. Of course, the future is what really matters.
China Oriental Group is not owned by hedge funds. Quite a few analysts cover the stock, so you could look into forecast growth quite easily.
Insider Ownership Of China Oriental Group
The definition of company insiders can be subjective, and does vary between jurisdictions. Our data reflects individual insiders, capturing board members at the very least. Management ultimately answers to the board. However, it is not uncommon for managers to be executive board members, especially if they are a founder or the CEO.
I generally consider insider ownership to be a good thing. However, on some occasions it makes it more difficult for other shareholders to hold the board accountable for decisions.
We can see that insiders own shares in China Oriental Group Company Limited. This is a big company, so it is good to see this level of alignment. Insiders own HK$562m worth of shares (at current prices). Most would say this shows alignment of interests between shareholders and the board. Still, it might be worth checking if those insiders have been selling.
General Public Ownership
The general public, with a 19% stake in the company, will not easily be ignored. While this group can't necessarily call the shots, it can certainly have a real influence on how the company is run.
Private Company Ownership
It seems that Private Companies own 32%, of the 581 stock. It's hard to draw any conclusions from this fact alone, so its worth looking into who owns those private companies. Sometimes insiders or other related parties have an interest in shares in a public company through a separate private company.
Public Company Ownership
It appears to us that public companies own 37% of 581. This may be a strategic interest and the two companies may have related business interests. It could be that they have de-merged. This holding is probably worth investigating further.
Next Steps:
While it is well worth considering the different groups that own a company, there are other factors that are even more important.
I always like to check for a history of revenue growth. You can too, by accessing this free chart of historic revenue and earnings in this detailed graph.
Ultimately the future is most important. You can access this freereport on analyst forecasts for the company.
NB: Figures in this article are calculated using data from the last twelve months, which refer to the 12-month period ending on the last date of the month the financial statement is dated. This may not be consistent with full year annual report figures.
We aim to bring you long-term focused research analysis driven by fundamental data. Note that our analysis may not factor in the latest price-sensitive company announcements or qualitative material.
If you spot an error that warrants correction, please contact the editor at editorial-team@simplywallst.com. This article by Simply Wall St is general in nature. It does not constitute a recommendation to buy or sell any stock, and does not take account of your objectives, or your financial situation. Simply Wall St has no position in the stocks mentioned. Thank you for reading.
About SEHK:581
China Oriental Group
Manufactures and sells iron and steel products for downstream steel manufacturers in the People’s Republic of China.
Adequate balance sheet second-rate dividend payer.
Market Insights

Advertisement
Community Narratives
The Future of Drug Testing? Fingerprint Tech Shows Serious Promise
Fair Value US$2.98|36.2% undervalued
JO
Community Contributor
Occidental Petroleum is set to achieve a 16% profit margin improvement
Fair Value US$55.05|17.7% undervalued
DZ
Community Contributor
Argan's Revenue Set to Soar with a 13.31% Growth in the Coming Decade
Fair Value US$284.68|23.2% undervalued
KE
Community Contributor
EU#1 - From German Startup to EU’s Biggest Company
Fair Value €248.62|3.6% overvalued
TO
Community Contributor