- Hong Kong
- /
- Metals and Mining
- /
- SEHK:581
China Oriental Group (HKG:581 investor five-year losses grow to 70% as the stock sheds HK$484m this past week


We're definitely into long term investing, but some companies are simply bad investments over any time frame. It hits us in the gut when we see fellow investors suffer a loss. For example, we sympathize with anyone who was caught holding China Oriental Group Company Limited (HKG:581) during the five years that saw its share price drop a whopping 79%. And some of the more recent buyers are probably worried, too, with the stock falling 29% in the last year. Shareholders have had an even rougher run lately, with the share price down 20% in the last 90 days. This could be related to the recent financial results - you can catch up on the most recent data by reading our company report.
Since China Oriental Group has shed HK$484m from its value in the past 7 days, let's see if the longer term decline has been driven by the business' economics.
View our latest analysis for China Oriental Group
In his essay The Superinvestors of Graham-and-Doddsville Warren Buffett described how share prices do not always rationally reflect the value of a business. By comparing earnings per share (EPS) and share price changes over time, we can get a feel for how investor attitudes to a company have morphed over time.
Over five years China Oriental Group's earnings per share dropped significantly, falling to a loss, with the share price also lower. At present it's hard to make valid comparisons between EPS and the share price. But we would generally expect a lower price, given the situation.
You can see below how EPS has changed over time (discover the exact values by clicking on the image).
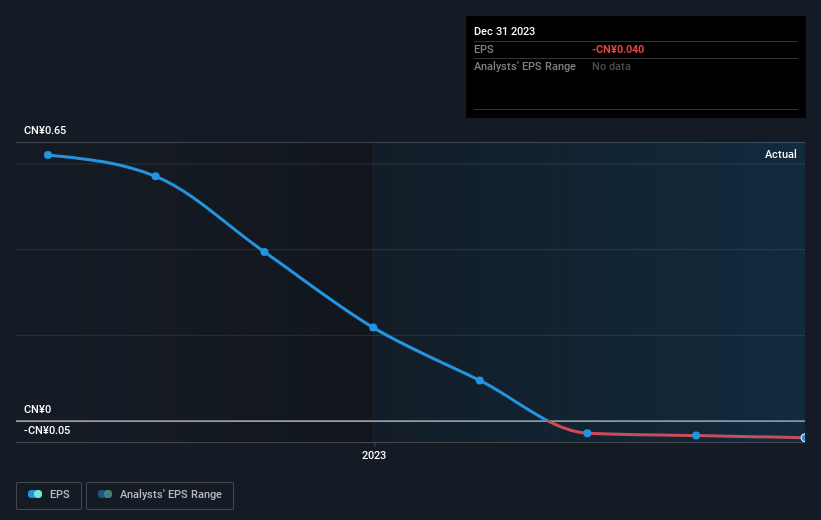
It might be well worthwhile taking a look at our free report on China Oriental Group's earnings, revenue and cash flow.
What About The Total Shareholder Return (TSR)?
Investors should note that there's a difference between China Oriental Group's total shareholder return (TSR) and its share price change, which we've covered above. The TSR is a return calculation that accounts for the value of cash dividends (assuming that any dividend received was reinvested) and the calculated value of any discounted capital raisings and spin-offs. Its history of dividend payouts mean that China Oriental Group's TSR, which was a 70% drop over the last 5 years, was not as bad as the share price return.
A Different Perspective
We regret to report that China Oriental Group shareholders are down 27% for the year. Unfortunately, that's worse than the broader market decline of 9.9%. However, it could simply be that the share price has been impacted by broader market jitters. It might be worth keeping an eye on the fundamentals, in case there's a good opportunity. Unfortunately, last year's performance may indicate unresolved challenges, given that it was worse than the annualised loss of 11% over the last half decade. Generally speaking long term share price weakness can be a bad sign, though contrarian investors might want to research the stock in hope of a turnaround. It's always interesting to track share price performance over the longer term. But to understand China Oriental Group better, we need to consider many other factors. Case in point: We've spotted 1 warning sign for China Oriental Group you should be aware of.
If you are like me, then you will not want to miss this free list of growing companies that insiders are buying.
Please note, the market returns quoted in this article reflect the market weighted average returns of stocks that currently trade on Hong Kong exchanges.
New: AI Stock Screener & Alerts
Our new AI Stock Screener scans the market every day to uncover opportunities.
• Dividend Powerhouses (3%+ Yield)
• Undervalued Small Caps with Insider Buying
• High growth Tech and AI Companies
Or build your own from over 50 metrics.
Have feedback on this article? Concerned about the content? Get in touch with us directly. Alternatively, email editorial-team (at) simplywallst.com.
This article by Simply Wall St is general in nature. We provide commentary based on historical data and analyst forecasts only using an unbiased methodology and our articles are not intended to be financial advice. It does not constitute a recommendation to buy or sell any stock, and does not take account of your objectives, or your financial situation. We aim to bring you long-term focused analysis driven by fundamental data. Note that our analysis may not factor in the latest price-sensitive company announcements or qualitative material. Simply Wall St has no position in any stocks mentioned.
About SEHK:581
China Oriental Group
Manufactures and sells iron and steel products for downstream steel manufacturers in the People’s Republic of China.
Mediocre balance sheet and slightly overvalued.
